Get Free NCERT Solutions for Class 10 Maths Chapter 14 Ex 14.4 PDF. Statistics Class 10 Maths NCERT Solutions are extremely helpful while doing your homework. Exercise 14.4 Class 10 Maths NCERT Solutions were prepared by Experienced LearnCBSE.in Teachers. Detailed answers of all the questions in Chapter 14 Maths Class 10 Statistics Exercise 14.4 provided in NCERT TextBook.
Topics and Sub Topics in Class 10 Maths Chapter 14 Statistics:
| Section Name | Topic Name |
| 14 | Statistics |
| 14.1 | Introduction |
| 14.2 | Mean Of Grouped Data |
| 14.3 | Mode Of Grouped Data |
| 14.4 | Median Of Grouped Data |
| 14.5 | Graphical Representation Of Cumulative Frequency Distribution |
| 14.6 | Summary |
- Statistics Class 10 Ex 14.1
- प्रश्नावली 14.1 का हल हिंदी में
- Statistics Class 10 Ex 14.2
- प्रश्नावली 14.2 का हल हिंदी में
- Statistics Class 10 Ex 14.3
- प्रश्नावली 14.3 का हल हिंदी में
- Statistics Class 10 Ex 14.4
- प्रश्नावली 14.4 का हल हिंदी में
You can also download the free PDF of Ex 14.4 Class 10 Statistics NCERT Solutions or save the solution images and take the print out to keep it handy for your exam preparation.
| Board | CBSE |
| Textbook | NCERT |
| Class | Class 10 |
| Subject | Maths |
| Chapter | Chapter 14 |
| Chapter Name | Statistics |
| Exercise | Ex 14.4 |
| Number of Questions Solved | 3 |
| Category | NCERT Solutions |
NCERT Solutions For Class 10 Maths Chapter 14 Statistics Ex 14.4
NCERT Solutions for Class 10 Maths Chapter 14 Statistics Ex 14.4 are part of NCERT Solutions for Class 10 Maths. Here we have given NCERT Solutions for Class 10 Maths Chapter 14 Statistics Exercise 14.4.
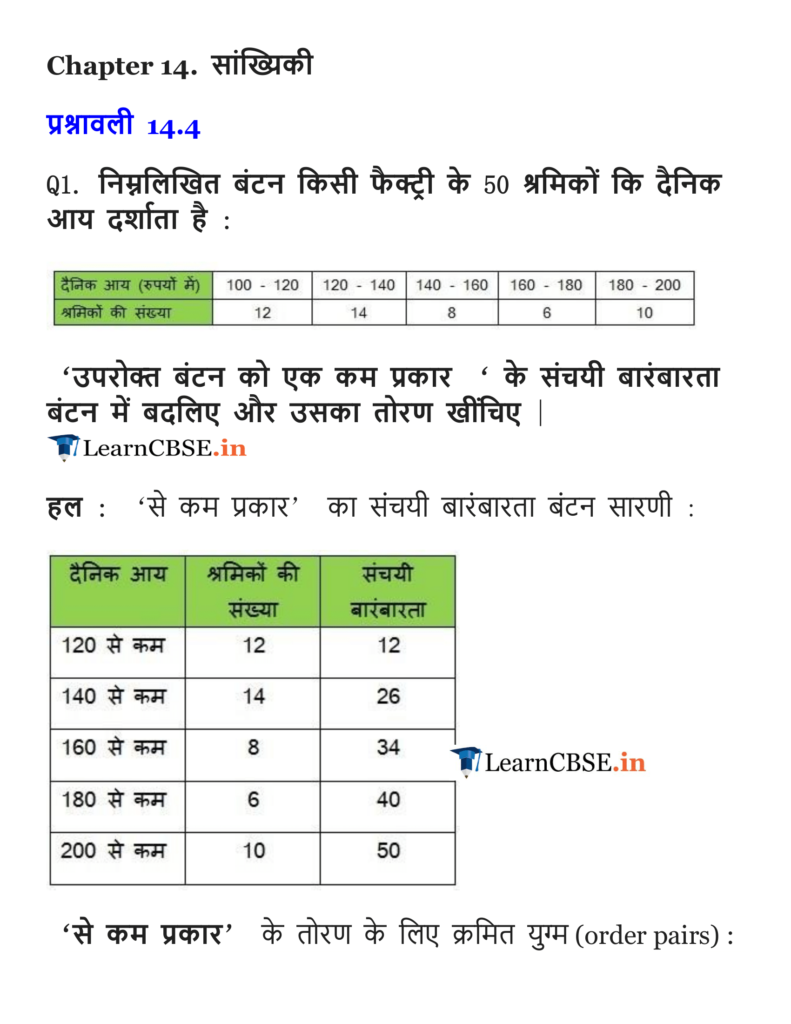
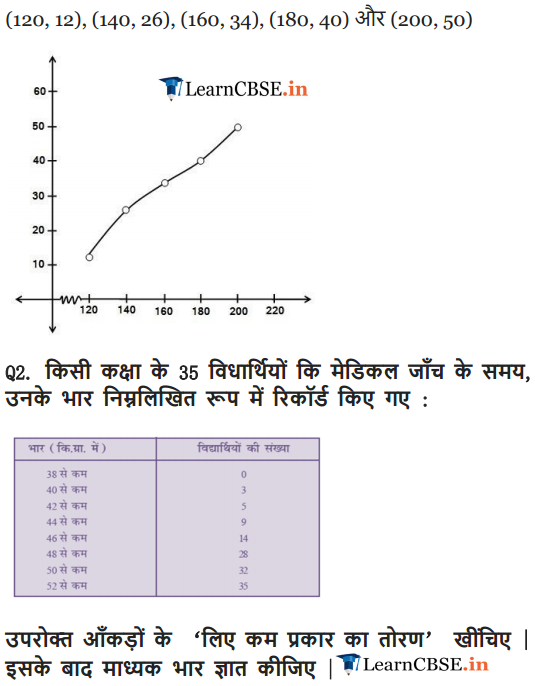
Ex 14.4 Class 10 Maths Question 1.
The following distribution gives the daily income of 50 workers of a factory.
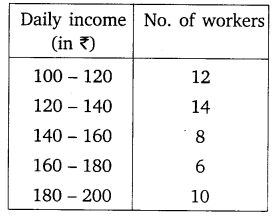
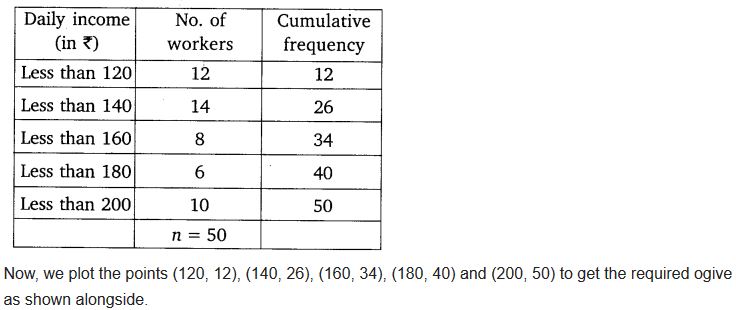
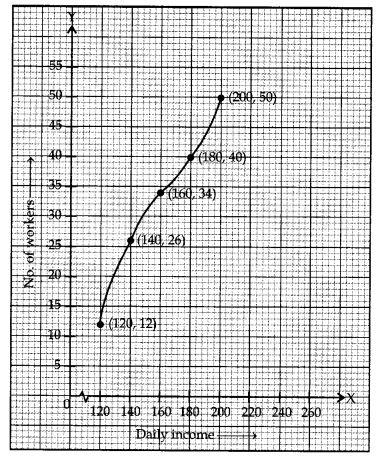
Convert the distribution above to a less than type cumulative frequency distribution, and draw its ogive.
Solution:
Download NCERT Solutions For Class 10 Maths Chapter 14 Statistics PDF
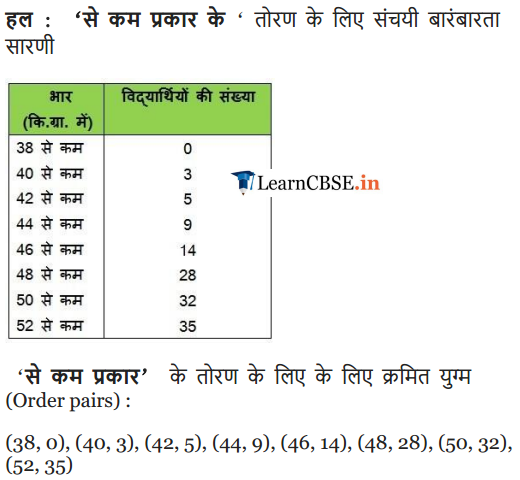
Ex 14.4 Class 10 Maths Question 2.
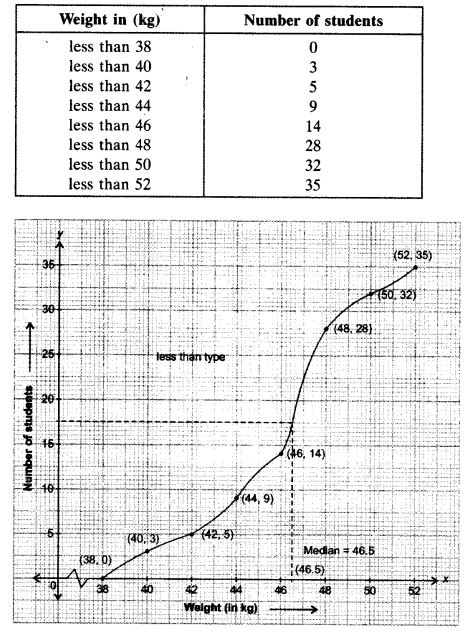
During the medical check-up of 35 students of a class, their weights were recorded as follows:
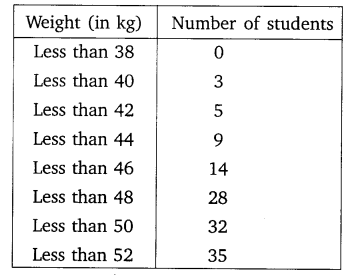
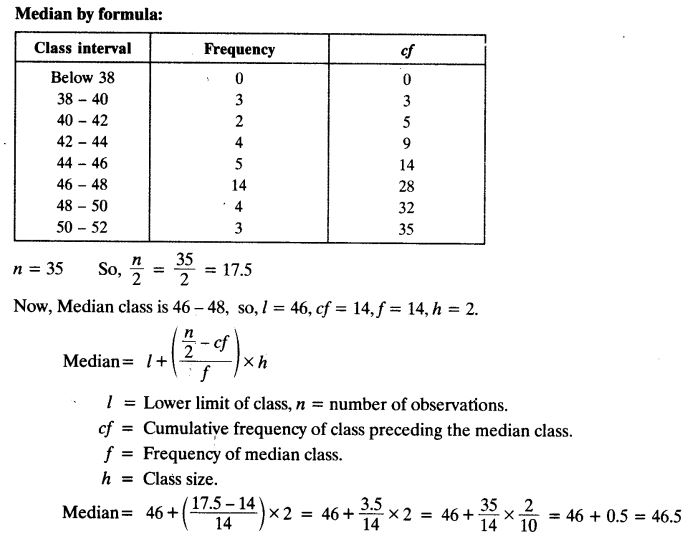
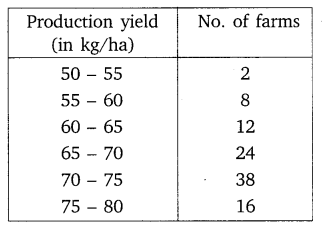
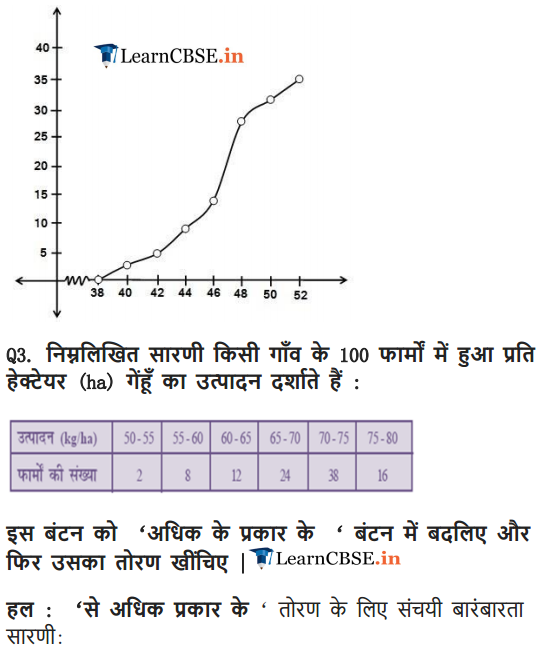
Draw a less than type ogive for the given data. Hence obtain the median weight from the graph and verify the result by using the formula.
Solution:
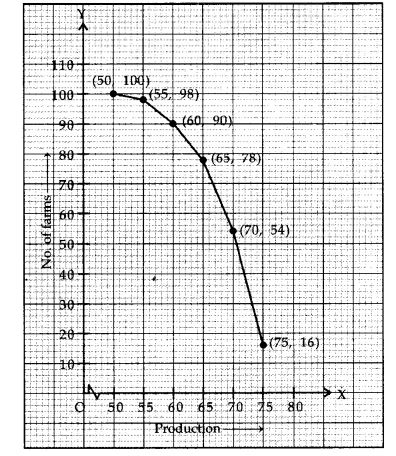
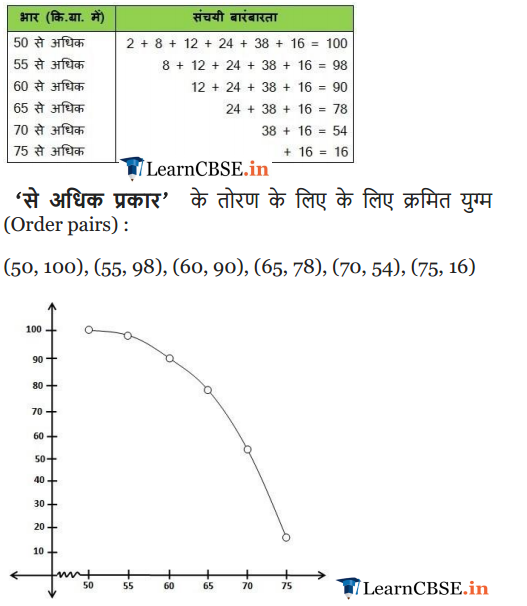
Ex 14.4 Class 10 Maths Question 3.
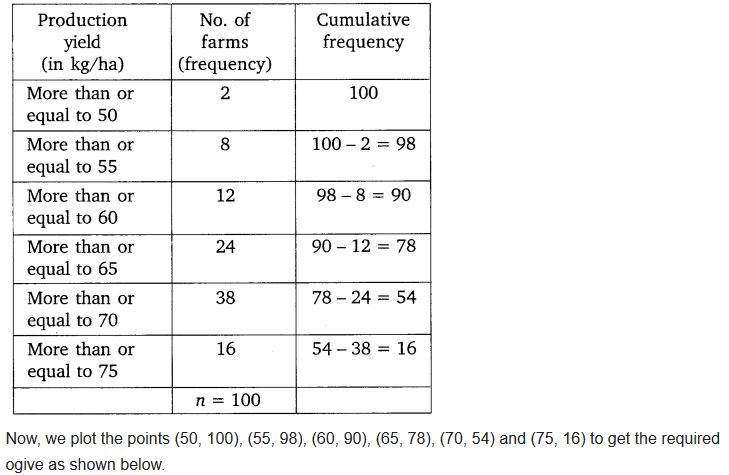
The following table gives production yield per hectare of wheat of 100 farms of a village.
Change the distribution to a more than type distribution, and draw its ogive.
Solution:
NCERT Solutions for Class 10 Maths Chapter 14 Statistics (Hindi Medium) Ex 14.4
NCERT Solutions for Class 10 Maths
- Chapter 3 Pair of Linear Equations in Two Variables
- Chapter 5 Arithmetic Progressions
- Chapter 6 Triangles
- Chapter 7 Coordinate Geometry
- Chapter 8 Introduction to Trigonometry
- Chapter 9 Some Applications of Trigonometry
- Chapter 10 Circles
- Chapter 11 Constructions
- Chapter 12 Areas Related to Circles
- Chapter 13 Surface Areas and Volumes
- Chapter 14 Statistics
- Chapter 15 Probability
We hope the NCERT Solutions for Class 10 Maths Chapter 14 Statistics Ex 14.4, help you. If you have any query regarding NCERT Solutions for Class 10 Maths Chapter 14 Probability Exercise 14.4, drop a comment below and we will get back to you at the earliest.