Statistics for Economics Class 11 NCERT Solutions Chapter 5 Measures of Central Tendency
Question 1.
Which average would be suitable in the following cases?
(i) Average size of readymade garments.
(ii) Average intelligence of students in a class.
(iii) Average production in a factory per shift.
(iv) Average wages in an industrial concern.
(v) When the sum of absolute deviations from average is least.
(vi) When quantities of the variable are in ratios.
(vii) In case of open-ended frequency distribution.
Answer:
(i) Mode Average size of any ready made garments should be the size for which demand is the maximum. Hence, the modal value which represents the value with the highest frequency should be taken as the average size to be produced.
(ii) Median It is the value that divides the series into two equal parts. Therefore, Median will be the best measure for calculating the average intelligence of students in a class as it will give the average intelligence such that there are equal number of students above and below this average. It will not be affected by extreme values.
(iii) Arithmetic Mean The average production in a factory per shift is best calculated by Arithmetic Mean as it will capture all types of fluctuations in production during the shifts.
(iv) Arithmetic Mean Arithmetic Mean will be the most suitable measure. It is calculated by dividing the sum of wages of all the workers by the total number of workers in the industrial concern. It gives a fair idea of average wage bill taking into account all the workers.
(v) Arithmetic Mean The algebraic sum of the deviations of values about Arithmetic Mean is zero. Hence, when the sum of absolute deviations from average is the least, then mean could be used to calculate the average.
(vi) Median Median will be the most suitable measure in case the variables are in ratios as it is least affected by the extreme values.
(vii) Median Median is the most suitable measure as it can be easily computed even in case of open ended frequency distribution and will not get affected by extreme values.
Question 2.
Indicate the most appropriate alternative from the multiple choices provided against each question.
(i) The most suitable average for qualitative measurement is
(a) Arithmetic mean
(b) Median
(c) Mode
(d) Geometric mean
(e) None of these
Answer:
(b) Median is the most suitable average for qualitative measurement because Median divides a series in two equal parts thus representing the average qualitative measure without being affected by extreme values.
(ii) Which average is affected most by the presence of extreme items?
(a) Median
(b) Mode
(c) Arithmetic Mean
(d) Geometric Mean
(e) Harmonic Mean
Answer:
(c) It is defined as the sum of the values of all observations divided by the number of observations and therefore it is. affected the most by extreme values.
(iii) The algebraic sum of deviation of a set of n values from AM is
(a) n
(b) 0
(c) 1
(d) None of these
Answer:
(b) This is one of the mathematical properties of arithmetic mean that the algebraic sum of deviation of a set of n values from AM is zero.
Question 3.
Comment whether the following statements are true or false.
(i) The sum of deviation of items from median is zero.
(ii) An average alone is not enough to compare series.
(iii) Arithmetic mean is a positional value.
(iv) Upper quartile is the lowest value of top 25% of items.
(v) Median is unduly affected by extreme observations.
Answer:
(i) False
This mathematical property applies to the arithmetic mean and not to median.
(ii) True
Average is not enough to compare the series as it does not explain the extent of deviation of different items from the central tendency and the difference in the frequency of values. These are measured by measures of dispersion and kurtosis.
(iii) False
Median is a positional value.
(iv) True
The upper quartile also called the third quartile, has 75 % of the items below it and 25 % of items above it.
(v) False
Arithmetic mean is unduly affected by extreme observations.
Question 4.
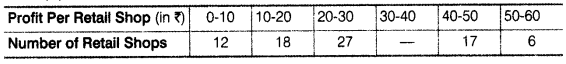
If the arithmetic mean of the data given below is 28, find (a) the missing frequency and (b) the median of the series
Answer:
(a) Let the missing frequency br f1.
Arithmetic Mean = 28
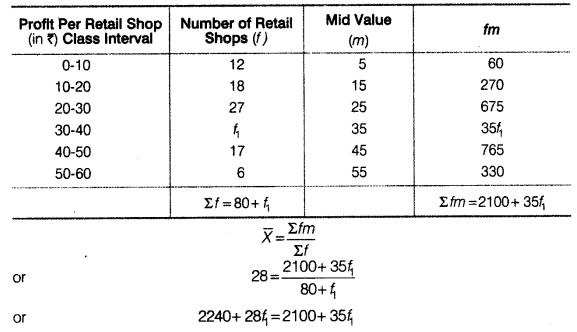
or 2240 -2100 = 35f1 = 28f1
or 140 = 7f1
f1 = 20
Hence, the missing frequency is 20.
(b)
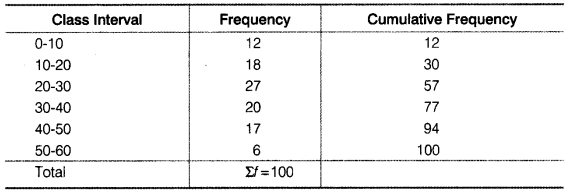
So, the Median class = Size of \(\left(\frac{N}{2}\right)\)th item = 50th term.
50th item lies in the 57th cumulative frequency and the corresponding class interval is 20-30.
Question 5.
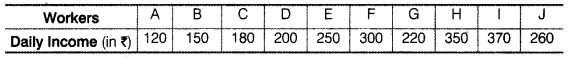
The following table gives the daily income of ten workers in a factory. Find the arithmetic mean.
Answer:
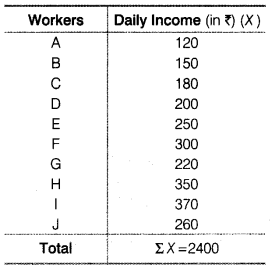
N = 10
\(\overline{X}=\frac{\Sigma X}{N}=\frac{2400}{10}=240\)
Arithmetic Mean = ₹ 240
Question 6.
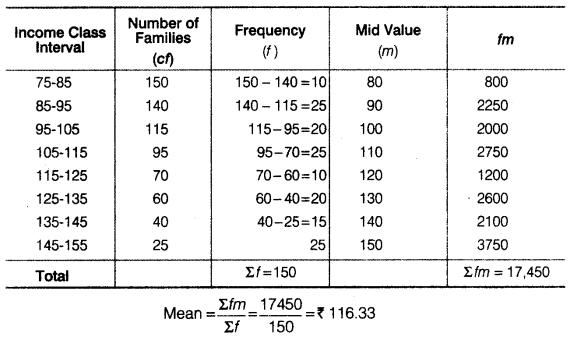
Following information pertains to the daily income of 150 families. Calculate the arithmetic mean.
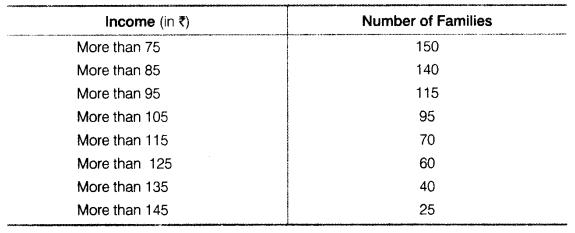
Answer:
Question 7.
The size of land holdings of 380 families in a village is given below. Find the median size of land holdings.
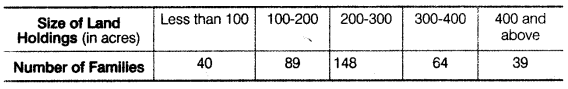
Answer:
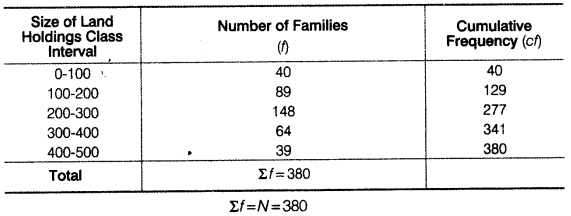
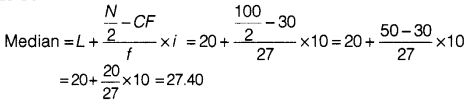
So, the median class = Size of \(\left(\frac{N}{2}\right)\) th item = 190 item
190th lies in the 129 th cumulative frequency and the corresponding class interval is 200-300.
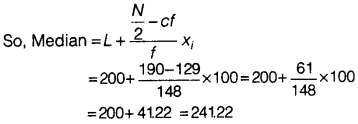
Median size of land holdings = 241.22 acres
Question 8.
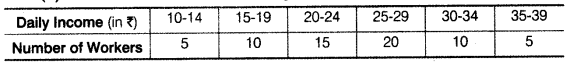
The following series relates to the daily income of workers employed in a firm. Compute (a) highest income of lowest 50% workers, (b) minimum income earned by the top 25% workers and (c) maximum income earned by lowest 25% workers.
Answer:
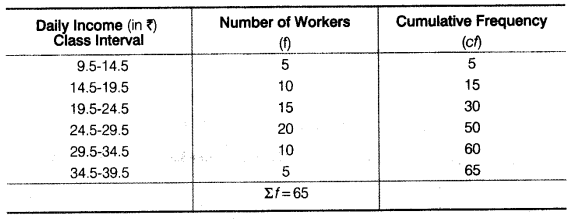
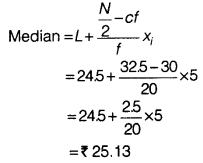
(a) Highest income of lowest 50% workers will be given by the median. Σf = N = 65
Median class = Size of \(\left(\frac{N}{2}\right)\)th item = Size of \(\left(\frac{65}{2}\right)\)th item=325 th item
32.5th item lies in the 50th cumulative frequency and the corresponding class interval is 24.5 – 29.5.
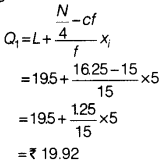
(b) Minimum income earned by top 25% workers will be given by the lower quartile Q1.
Class interval of Q1 = \(\left(\frac{N}{4}\right)\)th item
= \(\left(\frac{65}{4}\right)\)th item = 1625th item
16.25th item lies in the 30th cumulative frequency and the corresponding class interval is 19.5 – 24.5
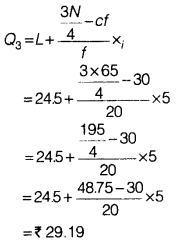
(c) Maximum income earned by lowest 25% workers will be given by the upper quartile Q3.
Class interval of Q3 = \(\left(\frac{N}{4}\right)\)th item
= 3\(\left(\frac{65}{4}\right)\)th item
= 3 × 1625th item
= 48.75th item
48.75th item lines in 50th item and the corresponding class interval is 24.5-29.5.
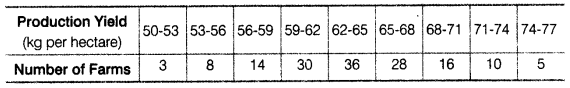
Question 9.
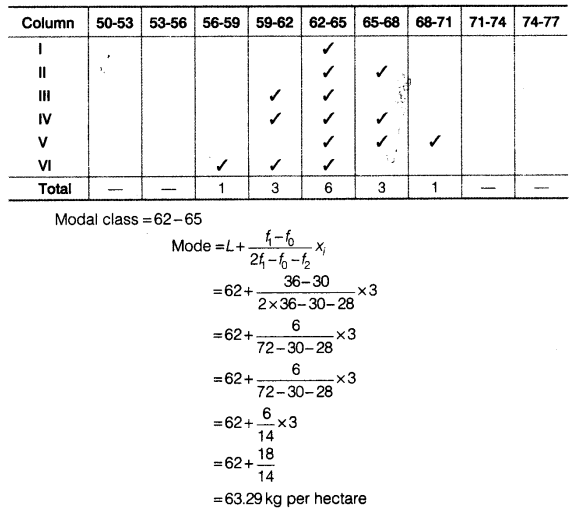
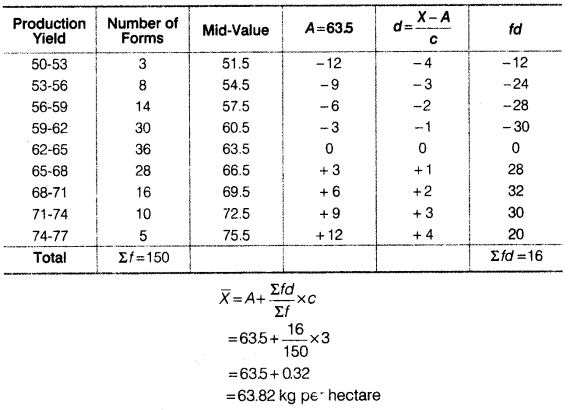
The following table gives production yield in kg per hectare of wheat of 150 farms in a village. Calculate the mean, median and mode production yield.
Answer:
(i) Mean
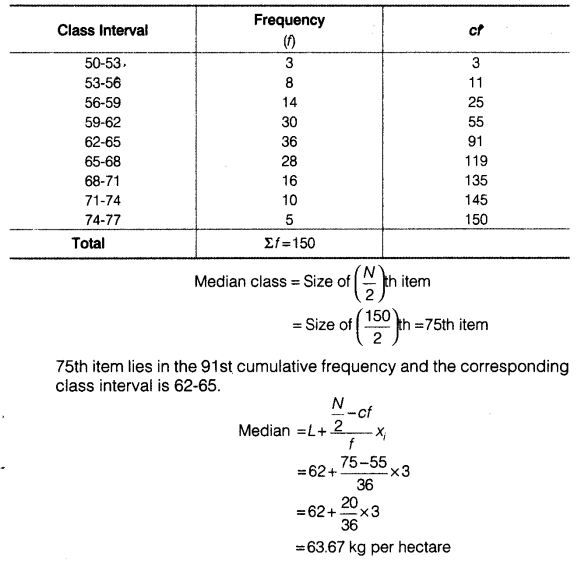
(ii) Median
(iii) Mode
Grouping Table
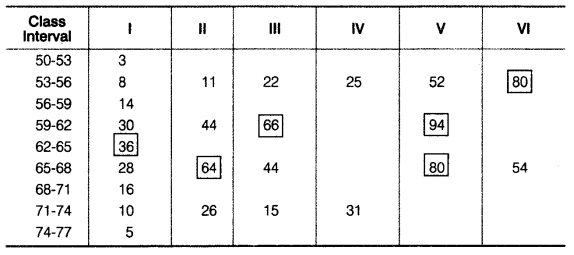
Analysis Table