NCERT Exemplar Class 7 Maths Chapter 3 Data Handling are part of NCERT Exemplar Class 7 Maths. Here we have given NCERT Exemplar Class 7 Maths Solutions Chapter 3 Data Handling.
NCERT Exemplar Class 7 Maths Solutions Chapter 3 Data Handling
Directions: In questions 1 to 16, there are four options, out of which only one is correct. Write the correct answer.
Question 1.
Let x, y, z be three observations. The mean of these observations is w xxyxz
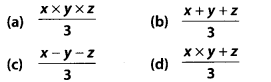
Solution:
Question 2.
The number of trees in different parks of a city are 33, 38, 48, 33, 34, 34, 33 and 24. The mode of this data is
(a) 24
(b) 34
(c) 33
(d) 48
Solution:
(c) The data is 33, 38, 48, 33, 34, 34, 33 and 24. Since, 33 occurs most frequently i.e., three times.
∴ Mode = 3
Question 3.
Which measures of central tendency get affected if the extreme observations on both the ends of a data arranged in descending order are removed?
(a) Mean and mode
(b) Mean and Median
(c) Mode and Median
(d) Mean, Median and Mode
Solution:
(a) Mean and mode affected by observations on the ends.
Question 4.
The range of the data :21, 6, 17, 18, 12, 8, 4, 13 is
(a) 17
(b) 12
(c) 8
(d) 15
Solution:
(a): Data is 21, 6, 17, 18, 12, 8, 4, 13 Highest observation is 21 and lowest observation is 4.
∴ Range = 21 – 4 = 17
Question 5.
The median of the data : 3, 4, 5, 6, 7, 3, 4 is
(a) 5
(b) 3
(c) 4
(d) 6
Solution:
(c): Arranging the data in ascending order, we have
3, 3, 4, 4, 5, 6, 7
Observations are odd in numbers.
∴ Medium is the middle most observation i.e., 4.
Question 6.
Out of 5 brands of chocolates in a shop, a boy has to purchase the brand which is most liked by children. What measure of central tendency would be most appropriate if the data is provided to him?
(a) Mean
(b) Mode
(c) Median
(d) Any of the three
Solution:
(b) Since mode is the measure of central tendency which is use to find that event which occurs most often.
Question 7.
There are 2 aces in each of the given set of cards placed face down. From which set are you certain to pick the two aces in the first go?
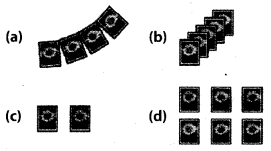
Solution:
(c) Since in option (c), only two cards are placed face down i.e., probability of picking up 2 aces in this is certain.
Question 8.
In the previous question, what is the probability of picking up an ace from the set (d)?
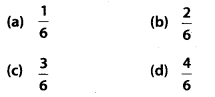
Solution:
(b) Set (d) has 6 cards.
We have to pick 2 aces.
∴ Probability (picking up 2 aces) \(=\frac{2}{6} \text { or } \frac{1}{3}\)
Question 9.
The difference between the highest and the lowest observations in a data is its
(a) frequency
(b) width
(c) range
(d) mode
Solution:
(c) Since, Range = Highest observation – Lowest observation
Question 10.
In a school, only 2 out of 5 students can participate in a quiz. What is the chance that a student picked at random makes it to the competition?
(a) 20%
(b) 40%
(c) 50%
(d) 30%
Solution:
(b) Probability (picking up student who is participating in a quiz) \(=\frac{2}{5}\)
∴ Required percentage \(=\frac{2}{5} \times 100=40 \%\)
Question 11.
Some integers are marked on a board. What is the range of these integers?
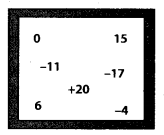
(a) 31
(b) 37
(c) 20
(d) 3
Solution:
(b) Lowest observation = -17
Highest observation – 20
∴ Range = 20 – (-17) = 20 + 17 = 37
Question 12.
On tossing a coin, the outcome is
(a) only head
(b) only tail
(c) neither head nor tail
(d) either head or tail
Solution:
(d) As we know that when a coin is tossed, it has two possible outcomes, head or tail.
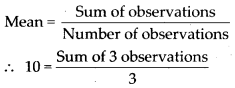
Question 13.
The mean of three numbers is 40. All the three numbers are different natural numbers. If lowest is 19, what could be highest possible number of remaining two numbers?
(a) 81
(b) 40
(c) 100
(d) 71
Solution:
(a) Lowest number = 19
Let highest number be x and middle number be y,
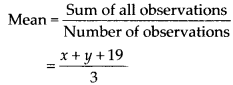
Given that mean is 40
\(\therefore 40=\frac{x+y+19}{3}\)
x + y + 19 = 120 ⇒ x + y = 120 – 19 = 101
Since 19 < x and 19 < y and x > y
∴ Maximum value of x could be 81 as 81 + 20 = 101 and 81 > 19,81 > 20, 20 > 19
Question 14.
Khilona earned scores of 97, 73 and 88 respectively in her first three examinations. If she scored 80 in the fourth examination, then her average score will be
(a) increased by 1
(b) increased by 1.5
(c) decreased by 1
(d) decreased by 1.5
Solution:
(d) Mean of the first three examinations scores
\(=\frac{97+73+88}{3}=\frac{258}{3}=86\)
Mean of first four examinations scores
\(=\frac{97+73+88+80}{4}=\frac{338}{4}=84.5\)
Thus, the average score of Khilona will be decreased by 86 – 84.5 = 1.5
Question 15.
Which measure of central tendency best represents the data of the most popular politician after a debate?
(a) Mean
(b) Median
(c) Mode
(d) Any of the above
Solution:
(c) Since the mode is the measure of central tendency which is use to find that event which occurs most often.
Question 16.
Which of the following has the same mean, median and mode?
(a) 6, 2, 5, 4, 3, 4, 1
(b) 4, 2, 2, 1, 3, 2, 3
(c) 2, 3, 7, 3, 8, 3,2
(d) 4,3, 4, 3, 4, 6, 4
Solution:
(d)
(a) Data is 1, 2, 3, 4, 4, 5, 6
![]()
Mode = 4 (∵ 4 occurs two times)
∴ Mean ≠ Mode
(b) Data is 1, 2, 2, 2, 3, 3, 5
![]()
Mode = 2 (∵ 2 occurs three times)
∴ Mean ≠ Mode
(c) Data is 2, 2, 3, 3, 3, 7, 8
![]()
Mode = 3 (∵ 3 occurs three times)
∴ Mean ≠ Mode
(d) Data is 3, 3, 4, 4, 4, 4, 6
![]()
Mode = 4 (∵ 4 occurs four times)
Since, observation are odd in number
∴ Median = Middle most observation i.e., 4
Hence mean = median = mode
Directions: In questions 17 to 31, fill in the blanks to make the statements true.
Question 17.
The difference between the highest and the lowest observations of a data is called ________
Solution:
Range
Question 18.
The mean of a data is defined as _________
Solution:
\(\frac { { Sumofallobservations } }{ { Numberofobservations } } \)
Question 19.
In a set of observations, the observation that occurs the most often is called ________
Solution:
Mode
Question 20.
In a given data, arranged in ascending or descending order, the middle most observation is called ________
Solution:
Median
Question 21.
Mean, Median, Mode are the measures of _________
Solution:
Central tendency
Question 22.
The probability of an event which is certain to happen is _________
Solution:
1
Question 23.
The probability of an event which is impossible to happen is ________
Solution:
0
Question 24.
When a die is thrown, the probability of getting a number less than 7 is ________
Solution:
1 : Total outcomes when a die is thrown are 1, 2, 3, 4, 5, 6 i.e., 6 in number.
All are less than 7.
∴ Probability (getting a number less than 7) \(=\frac{6}{6}=1\)
Question 25.
In throwing a die the number of possible outcomes is ________
Solution:
6 : When a die is thrown then possible outcomes are 1, 2, 3, 4, 5, 6 i.e., 6 in number.
Question 26.
________ can be used to compare two collections of data.
Solution:
A double bar graph
Question 27.
The representation of data with bars of uniform width is called _________
Solution:
Bar graph
Question 28.
If the arithmetic mean of 8, 4, x, 6, 2,7 is 5, then the value of x is ______
Solution:
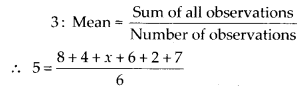
\(\therefore 5=\frac{8+4+x+6+2+7}{6}\)
⇒ x + 27 – 30 ⇒ x= 3
Question 29.
The median of any data lies between the _______ and ______ observations.
Solution:
Minimum, maximum : Since, median is the middle most observation.
Question 30.
Median is one of the observations in the data if number of observations is
Solution:
Odd
Question 31.
Rohit collected the data regarding weights of students of his class and prepared the following table:
| Weight in (kg) | 44-47 | 48 – 51 | 52 – 55 | 56 – 60 |
| Number of Students | 3 | 5 | 25 | 7 |
A student is to be selected randomly from his class for some competition. The probability of selection of the student is highest whose weight is in the interval ________
Solution:
52 – 55 : Since maximum number of students i.e., 25 lies in interval 52-55.
Directions: In questions 32 to 49, state whether the statements are True or False.
Question 32.
If a die is thrown, the probability of getting a number greater than 6 is 1.
Solution:
False When a die is thrown all possible outcome are less than or equal to 6. There is no number which is greater than 6.
∴ Probability of getting a number greater than 6 is 0.
Question 33.
When a coin is tossed, there are 2 possible outcomes.
Solution:
True
When a coin is tossed, there are two possible outcomes i.e., Head or Tail.
Question 34.
If the extreme observations on both the ends of a data arranged in ascending order are removed, the median gets affected.
Solution:
False
Since extreme observations affect mean and mode not the median.
Question 35.
The measures of central tendency may not lie between the maximum and minimum values of data.
Solution:
False
Since measures of central tendency always lie between maximum and minimum values of data.
Question 36.
It is impossible to get a sum of 14 of the numbers on both dice when a pair of dice is thrown together.
Solution:
True
Since the maximum sum of the numbers on both dice is 12
Question 37.
The probability of the spinning arrow stopping in the shaded region (see figure) is \(\frac{1}{2}\)
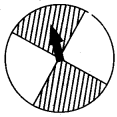
Solution.
True
Total parts = 4
Shaded parts = 2
∴ Probability (spining arrow stopping in shaded region)
\(=\frac{2}{4}=\frac{1}{2}\)
Question 38.
A coin is tossed 15 times and the outcomes are recorded as follows: H T T H T H H H T T H T H T T. The chance of occurrence of a head is 50 percent.
Solution:
False
Total outcomes = 15
Number of occurrence of head = 7 .
∴ The percentage of the chance of occurrence of a head \(=\frac{7}{15} \times 100=46.6 \%\)
Question 39.
Mean, Median and Mode may be the same for some data.
Solution:
True
Question 40.
The probability of getting an ace out of a deck of cards is greater than 1.
Solution:
False
Since, probability of getting an ace out of a deck of cards is \(\frac{4}{52}\) i.e., \(\frac{1}{13}\) which is less than 1.
Question 41.
Mean of the data is always from the given data.
Solution:
False
Mean of the data may or may not from the given data.
Question 42.
Median of the data may or may not be from the given data.
Solution:
True
Question 43.
Mode of the data is always from the given data.
Solution:
True
Question 44.
Mean of the observations can be lesser than each of the observations.
Solution:
False
Mean of the data cannot be lesser than each of the observations.
Question 45.
Mean can never be a fraction.
Solution:
False
Mean may be a fraction.
Question 46.
Range of the data is always from the data.
Solution:
False
Since the range is the difference between the highest observation and lowest observation.
∴ It may or may not be from the data.
Question 47.
The data 12, 13, 14, 15, 16 has every observation as mode.
Solution:
True
Data is 12, 13, 14, 15, 16
Since, every observation occurs one time.
∴ Every observation can taken as mode.
Question 48.
The range of the data 2,-5, 4, 3, 7, 6 would change if 2 was subtracted from each value in the data.
Solution:
False
Data is 2, -5, 4, 3, 7, 6
Range = Highest value – Lowest value = 7 – (-5) = 7 + 5 = 12
After subtracting 2 from each value, data becomes 0, -7, 2, 1, 5, 4
Now, range = Highest value – Lowest value = 5 – (-7) – 5 + 7 = 12
Hence, in both cases range is same.
Question 49.
The range of the data 3, 7, 1, -2, 2, 6, -3, -5 would change if 8 was added to each value in the data.
Solution:
False
Data is 3, 7, 1,-2, 2, 6, -3, -5
Range = Highest value – Lowest value = 7 – (-5) = 12
After adding 8 to each value, data becomes 11, 15, 9, 6, 10, 14, 5, 3
∴ Range = Highest value – Lowest value = 15 – 3 = 12
Hence, in both cases range is same.
Question 50.
Calculate the Mean, Median and Mode of the following data:
5, 10, 10, 12, 13.
Are these three equal?
Solution:
Data is 5, 10, 10, 12, 13
Since, 10 occurs most frequently i.e., two times.
∴ Mode = 10
Observations are odd in number.
∴ Median = Middle most observation i.e., 3rd observation
∴ Median = 10
Mean = Median = Mode = 10
Yes, these three are equal.
Question 51.
Find the mean of the first ten even natural numbers.
Solution:
First ten even natural numbers are 2, 4, 6, 8, 10, 12, 14, 16, 18, 20
Question 52.
A data constitutes of heights (in cm) of 50 children. What do you understand by mode for the data?
Solution:
Mode is the height that occurs most frequently in the set of heights of 50 children.
Question 53.
A car seller collects the following data of cars sold in his shop.
| Colour of Car | Number of Cars Sold |
| Red | 15 |
| Black | 20 |
| White | 17 |
| Silver | 12 |
| Others | 9 |
(a) Which colour of the car is most liked?
(b) Which measure of central tendency was used in (a)?
Solution:
(a) Black colour of car is most liked because number of cars sold of black car is greatest.
(b) Mode is used in (a) part.
Question 54.
The marks in a subject for 12 students are as follows: 31, 37, 35, 38, 42, 23, 17, 18, 35, 25, 35, 29 For the given data, find the
(a) Range
(b) Mean
(c) Median
(d) Mode
Solution:
Arranging the data in ascending order, we get 17, 18, 23, 25, 29, 31, 35, 35, 35, 37, 38, 42
(a) Range – Highest value – Lowest value = 42 – 17 = 25
(c) Observations are even in number.
∴ Median = Mean of two middle most observations
\(=\frac{31+35}{2}=\frac{66}{2}=33\)
(d) Since, 35 occurs most frequently i.e., 3 times.
∴ Mode = 35.
Question 55.
The following are weights (in kg) of 12 people.
70, 62, 54, 57, 62, 84, 75, 59, 62, 65, 78, 60
(a) Find the mean of the weights of the people.
(b) How many people weigh above the mean weight?
(c) Find the range of the given data.
Solution:
Arranging the data in ascending order, we get
54, 57, 59, 60, 62, 62, 62, 65, 70, 75, 78, 84
(b) Since, mean = 65.6 kg
∴ 4 people have weight above mean weight.
(c) Range = Highest weight – Lowest weight
= (84 – 54) kg = 30 kg
Question 56.
Following cards are put facing down:
![]()
What is the chance of drawing out
(a) a vowel
(b) A or
(c) a card marked U
(d) a consonant
Solution:
Total cards = 5
(a) Here, all cards are vowel.
∴ Chance of drawing out a vowel is 1.
(b) Chance of drawing out a card marked A or I \(=\frac{2}{5}\)
(c) Since, one card has marked U.
∴ Chance of drawing out a card marked U is \(=\frac{1}{5}\)
(d) Since, there is no consonant.
∴ Chance of drawing out a consonant is 0.
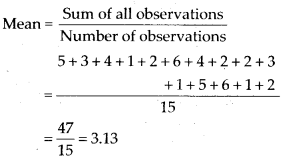
Question 57.
For the given data given below, calculate the mean of its median and mode.
6, 2, 5, 4, 3, 4, 4, 2, 3
Solution:
Arranging the data in a ascending order, we get
2, 2, 3, 3, 4, 4, 4, 5, 6
Since, observations are odd in number.
∴ Median = Middle most observation = 4
Since, 4 occurs most frequently i.e., 3 times
∴ Mode = 4
Now, mean of median and mode is given by
![]()
Question 58.
Find the median of the given data if the mean is 4.5.
5, 7, 7, 8, x, 5, 4, 3, 1, 2
Solution:
The data is 5, 7, 7, 8, 1,5, 4, 3, 1, 2
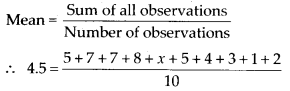
⇒ 45 = x + 42
⇒ x = 45 – 42 =3
Now, arranging the data in ascending order, we get
1, 2, 3, 3, 4, 5, 5, 7, 7, 8
Since, observations are even in number.
∴ Median = Mean of two middle most observations
\(=\frac{4+5}{2}=\frac{9}{2}=4.5\)
Question 59.
What is the probability of the sun setting tomorrow?
Solution:
It is certain that sun setting every evening
∴ Probability of sun setting tomorrow is 1.
Question 60.
When a spinner with three colours (see figure) is rotated, which colour has more chance to show up with arrow than the others?

Solution:
Colour Y has more chance to show up with arrow than the others because Y has more region than both colours B and R.
Question 61.
What is the probability that a student chosen at random out of 3 girls and 4 boys is a boy?
Solution:
Total number of students 3 + 4 = 7
Total number of boys = 4
∴ Probability (student chosen is a boy) \(=\frac{4}{7}\)
Question 62.
The letters written on paper slips of the word MEDIAN are put in a bag. If one slip is drawn randomly, what is the probability that it bears the letter D?
Solution:
Total letters in the word MEDIAN = 6 D occurs only at once.
∴ Probability (Drawn slip bears the letter D) \(=\frac{1}{6}\)
Question 63.
Classify the following events as certain to happen, impossible to happen, may or may not happen:
(a) Getting a number less than 1 on throwing a die.
(b) Getting head when a coin is tossed.
(c) A team winning the match.
(d) Christmas will be on 25 December.
(e) Today moon will not revolve around the earth.
(f) A ball thrown up in the air will fall down after some time.
Solution:
(a) Since, no number is less than 1 on a die.
∴Getting a number less than 1 on throwing a die is impossible to happen.
(b) When a coin is tossed two outcomes are possible i.e., Head or Tail.
∴ Getting head when a coin is tossed may or may not happen.
(c) A team winning the match may or may not happen because a team can lose the match.
(d) Christmas will be on 25 December is certain to happen.
(e) Since, moon always revolves around the earth.
∴Today moon will not revolve around the earth is impossible to happen.
(f) A ball thrown up in the air will fall down after some time is certain to happen due to gravity of earth.
Question 64.
A die was thrown 15 times and the outcomes recorded were 5, 3, 4, 1, 2, 6, 4, 2, 2, 3, 1, 5, 6, 1, 2 Find the mean, median and mode of the data.
Solution:
Arranging the data in ascending order, we get
1, 1, 1, 2, 2, 2, 2, 3, 3, 4, 4, 5, 5, 6, 6
Since, observations are odd in number,
∴ Median = Middle most observation i.e., 8th observation = 3
Since, 2 occurs most frequently i.e., 4 times
∴ Mode = 2
Question 65.
Find the mean of the first six multiples of 4.
Solution:
First six multiples of 4 are 4, 8, 12, 16, 20, 24
Question 66.
Find the median of the first nine even natural numbers.
Solution:
First nine even natural numbers are
2, 4, 6, 8, 10, 12, 14, 16, 18
Since, observations are odd in number.
∴ Median = Middle most observation i.e., 5th observation = 10
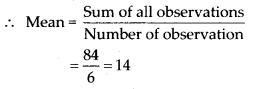
Question 67.
The mean of three numbers is 10. The mean of other four numbers is 12. Find the mean of all the numbers.
Solution:
Mean of 3 numbers = 10
Mean of 4 numbers = 12
⇒ Sum of 3 observations = 30 —— (1)
![]()
⇒ Sum of 4 observations = 48 ——- (2)
From (1) and (2), we get
Sum of 7 observations = 30 + 48 = 78
Question 68.
Find the mode of the given data:
10, 8, 4, 7, 8, 11, 15, 8, 4, 2, 3, 6,8
Solution:
Arranging the data in ascending order, we get
2, 3, 4, 4, 6, 7, 8, 8, 8, 8, 10, 11, 15
Since, 8 occurs most frequently in the data
i.e., 4 times. ∴Mode – 8
Question 69.
Given below are heights of 15 boys of a class measured in cm:
128, 144, 146, 143, 136, 142, 138, 129, 140, 152, 144, 140, 150, 142, 154.
Find
(a) The height of the tallest boy.
(b) The height of the shortest boy.
(c) The range of the given data.
(d) The median height of the boys.
Solution:
Arranging the heights in ascending order, we get
128, 129, 136, 138, 140, 140, 142, 142, 143, 144, 144, 146, 150, 152, 154
(a) Height of the tallest boy is 154 cm.
(b) Height of the shortest boy is 128 cm.
(c) Range = Highest value – Lowest value
= (154 – 128) cm = 26 cm
(d) Since, observations are odd in number
∴ Median height = Middle most height = 142 cm
Question 70.
Observe the data and answer the questions that follow:
16, 15, 16, 16, 8, 15, 17
(a) Which data value can be put in the data so that the mode remains the same?
(b) At least how many and which value(s) must be put in to change the mode to 15?
(c) What is the least number of data values that must be put in to change the mode to 17? Name them.
Solution:
The data is 16, 15, 16, 16, 8, 15, 17 (a) Since, 16 occurs most frequently in the data i.e., 3 times.
∴ Mode = 16
15 occurs two times, therefore if 15 will be put in the data, mode would be changed.
Hence, 8 or 17 or 16 can be put in the data so that mode remain the same.
(b) 15 occurs two times, therefore mode will be 15 if 15 occurs atleast 4 times.
∴ Atleast two times 15 must be put into the data to change the mode to 15.
(c) 17 occurs only once in the data.
∴ Atleast 3 times 17 must be put in to the data to change the mode to 17.
Question 71.
Age (in years) of 6 children of two groups are recorded as below:
| Age (in Years) | Group A | 7 | 7 | 9 | 8 | 10 | 10 |
| Group B | 7 | 9 | 11 | 12 | 12 | 12 |
(a) Find the mode and range for each group.
(b) Find the range and mode if the two groups are combined together.
Solution:
(a) For group A;
Both 7 and 10 occurs two times.
∴ Mode = 7 year and 10 year.
Range = Highest age – Lowest age
= (10 – 7) year = 3 year
For group B;
12 occurs most frequently i.e., 3 times.
∴ Mode = 12
Range – Highest age – Lowest age
= (12 – 7) year = 5 year
(b) If both groups A and B are combined, then arranging the data in ascending order, we get
7, 7, 7, 8, 9, 9, 10, 10, 11, 12, 12, 12
In this data both 7 and 12 occurs most frequently i.e., 3 times.
∴ Mode = 7 year and 12 year
Range = Highest age – Lowest age
= (12 – 7) year = 5 year
Question 72.
Observe the given bar graph carefully and answer the questions that follow.
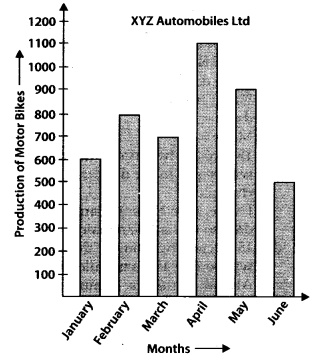
(a) What information does the bar graph depict?
(b) How many motor bikes were produced in the first three months?
(c) Calculate the increase in production in May over the production in January.
(d) In which month the production was minimum and what was it?
(e) Calculate the average (mean) production of bikes in 6 months.
Solution:
(a) The bar graph depicts the information about production of motor bikes by XYZ automobiles Ltd. during January to June.
(b) The motor bikes produced in first three months are = 600 + 800 + 700 = 2100
(c) Production in January = 600
Production in May = 900
∴ Increase in production in May over the production in January = 900 – 600 = 300
(d) In the month of June the production was minimum and it was 500.
Question 73.
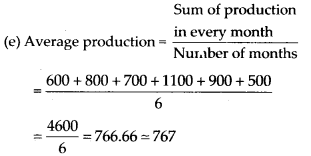
The bar graph given below shows the marks of students of a class in a particular subject:
Study the bargraph and answer the following questions:
(a) If 40 is the pass mark, then how many students have failed?
(b) How many students got marks from 50 to 69?
(c) How many students scored 90 marks and above?
(d) If students who scored marks equal to or above 80 are given merits then how many merit holders are there?
(e) What is the strength of the class?
Solution:
(a) Number of students scored marks below 40 i.e., 30-39 ate 4 . 4 students have failed.
(b) Number of students got marks from 50 to 59 is 7 and number of students got marks from 60 to 69 is 11.
∴ 7 + 11 = 18 students got marks from 50 to 69.
(c) 4 students scored marks from 90 and above.
(d) Number of students got marks from 80 to 89 is 6. Number of students got marks from 90 to 92 is 4.
∴ 6 + 4 = 10 students are merit holders.
(e) Total number of students in the class = 4 + 2 +7 + 11 + 8 + 6 + 4 = 42
Question 74.
Study the bar graph given below and answer the questions that follow.
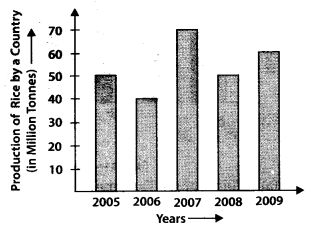
(a) What information does the above bar graph represent?
(b) In which year was production the least?
(c) After which year was the maximum rise in production?
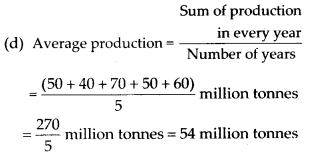
(d) Find the average production of rice during the 5 years.
(e) Find the difference of rice production between the years 2006 and 2008.
Solution:
(a) The bar graph represents the information about the production of rice by a country during the years 2005 to 2009
(b) In 2006, the production was least.
(c) In 2007, there was a maximum rise in the production
∴ After 2006, the production has maximum rise.
(e) Rice production in 2006 = 40 million tonnes
Rice production in 2008 = 50 million tonnes
∴ Difference = (50 – 40) million tonnes = 10 million tonnes
Question 75.
Study the bar graph given below and answer the questions that follow:
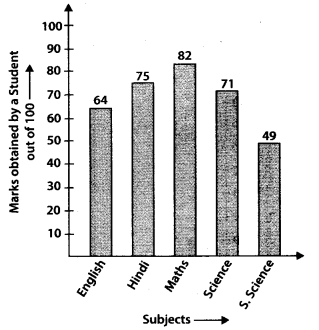
(a) What information is depicted from the bar graph?
(b) in which subject is the student very good?
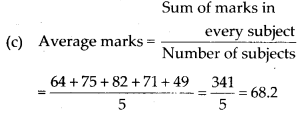
(c) Calculate the average marks of the student.
(d) If 75 and above marks denote a distinction, then name the subjects in which the student got distinction.
(e) Calculate the percentage of marks the student got out of 500.
Solution:
(a) The bar graph depicts the information about marks obtained by a student in 5 different subjects.
(b) Since, student get highest marks in Maths i.e., 82
∴ The student is very good in Maths.
(d) The student got 75 marks in Hindi and 82 marks in Maths.
∴ In Hindi and Maths, the student got distinction.
(e) Total marks obtained by the student = 64 + 75 + 82 + 71 + 49 = 341
∴ Percentage marks \(=\frac{341}{500} \times 100=68.2 \%\)
Question 76.
The bar graph given below represents the circulation of newspapers (dailies) in a town in six languages (the figures are approximated to hundreds).
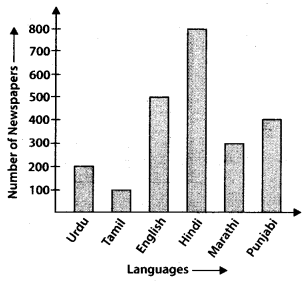
Study the bar graph and answer the following questions:
(a) Find the total number of newspapers read in Hindi, Punjabi, Urdu, Marathi and Tamil.
(b) Find the excess number of newspapers read in Hindi than those in English.
(c) Name the language in which the least number of newspapers are read.
(d) Write the total circulation of newspapers in the town.
Solution:
(a) Total number of newspapers read in Hindi, Punjabi, Urdu, Marathi and Tamil = 800 + 400 + 200 + 300 + 100 = 1800
(b) Number of newspapers read in Hindi = 800
Number of newspapers read in English = 500
∴ 800 – 500 = 300 excess newspapers read in Hindi than in English.
(c) The least number of newspapers are read in Tamil language.
(d) Total number of newspapers in the town = 200 + 100 + 500 + 800 + 300 + 400 = 2300
Question 77.
Study the double bar graph given below and answer the following questions:
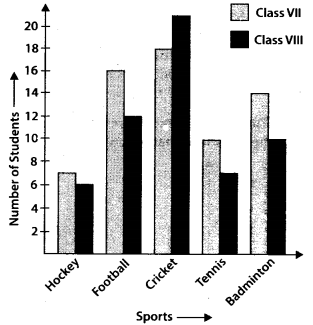
(a) Which sport is liked the most by Class VIII students?
(b) How many students of Class VII like Hockey and Tennis in all?
(c) How many students are there in Class VII?
(d) For which sport is the number of students of Class VII less than that of Class VIII?
(e) For how many sports students of Class VIII are less than Class VII?
(f) Find the ratio of students who like Badminton in Class VII to students who like Tennis in Class VIII.
Solution:
(a) Cricket has heighest value for Class VIII students in the graph.
∴ Cricket is liked the most by Class VIII students.
(b) Number of students like Hockey of Class VII = 7
Number of students like Tennis of Class VII = 10
∴ 7 + 10 = 17 students of Class VII like Hockey and Tennis.
(c) Total number of students in Class VII = 7 + 16 + 18 + 10 + 14 = 65
(d) For Cricket only, the number of students of Class VII is less than that of Class VIII.
(e) For Hockey Football, Tennis and Badminton i.e., 4 sports, students of Class VIII are less than that of Class VII.
(f) Number of students like Badminton in Class VII = 14
Number of students like Tennis in Class VIII = 7
∴ Required ratio \(=\frac{14}{7}=\frac{2}{1} \text { i.e., } 2 : 1\)
Question 78.
Study the double bar graph shown below and answer the questions that follow:
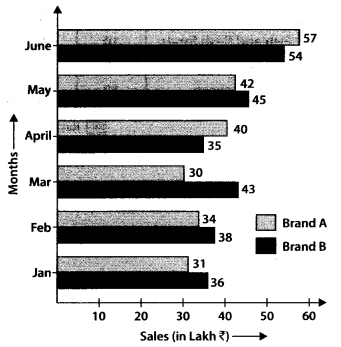
(a) What information is represented by the above double bar graph?
(b) in which month sales of Brand A decreased as compared to the previous month?
(c) What is the difference in sales of both the Brands for the month of June?
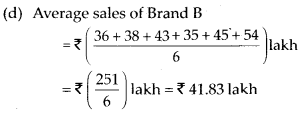
(d) Find the average sales of Brand B for the six months.
(e) List all months for which the sales of Brand B was less than that of Brand A.
(f) Find the ratio of sales of Brand A as compared to Brand B for the month of January
Solution:
(a) The double bar graph represents the information about the comparison sales of two brands A and B during January to June.
(b) Sales of Brand A in the month of March is less than sales in the month of February.
∴ In the month of March, sales of Brand A decreased as compared to the previous month.
(c) Sales of Brand A in the month of June = ₹ 57 lakh
Sales of Brand B in the month of June = ₹ 54 lakh.
Difference in sales = ₹ 57 lakh – ₹ 54 lakh = ₹ 3 lakh
(e) In the month of April and June, the sales of Brand B was less than that of Brand A.
(f) Sales of Brand A in the month of January = ₹ 31 lakh
Sales of Brand B in the month of January = ₹ 36 lakh
∴ Required ratio \(=\frac{31}{36} \text { i.e., } 31 : 36\)
Question 79.
Study the double bar graph given below and answer the questions that follow:
(a) What information is compared in the above given double bar graph?
(b) Calculate the ratio of minimum temperatures in the year 2008 to the year 2009 for the month of November.
(c) For how many months was the minimum temperature in the year 2008 greater than that of year 2009? Name those months.
(d) Find the average minimum temperature for the year 2008 for the four months.
(e) in which month is the variation in the two temperatures maximum?
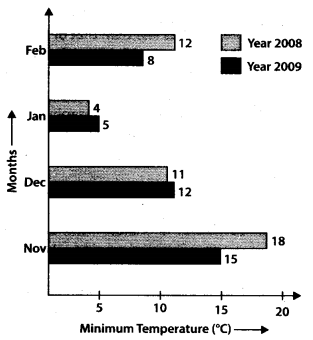
Solution:
(a) The double bar graph compares the information about minimum temperature (oC) of year 2008 and year 2009 during the months November to February
(b) Minimum temperature in the year 2008 for the month of November – 18°C
Minimum temperature in the year 2009 for the month of November = 15°C
∴ Required ratio \(=\frac{18}{15}=\frac{6}{5} \quad \text { i.e., } 6 : 5\)
(c) For the month of November and February, i.e., 2 months the minimum temperature in 2008 was greater than that of 2009
(d) Average minimum temperature for 2008
\(=\frac{18^{\circ} \mathrm{C}+11^{\circ} \mathrm{C}+4^{\circ} \mathrm{C}+12^{\circ} \mathrm{C}}{4}=\frac{45^{\circ} \mathrm{C}}{4}\)
= 11.25°C
(e) In the month of February, the variation in two temperatures is maximum.
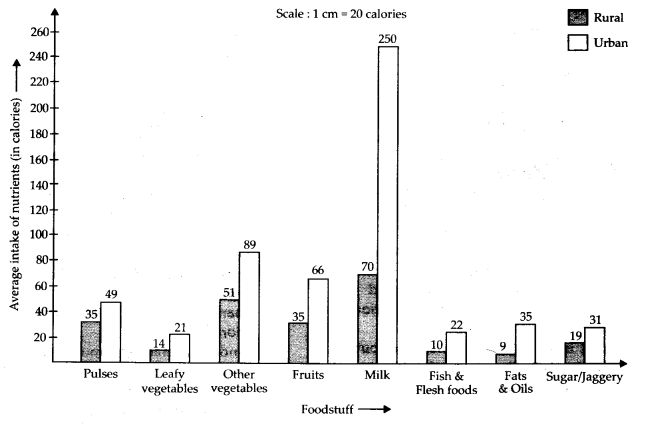
Question 80.
The following table shows the average intake of nutrients in calories by rural and urban groups in a particular year. Using a suitable scale for the given data, draw a double bar graph to compare the data.
| Foodstuff | Rural | Urban |
| Pulses | 35 | 49 |
| Leafy vegetables | 14 | 21 |
| Other vegetables | 51 | 89 |
| Fruits | 35 | 66 |
| Milk | 70 | 250 |
| Fish and flesh foods | 10 | 22 |
| Fats and Oils | 9 | 35 |
| Sugar/Jaggery | 19 | 31 |
Solution:
Question 81.
Study the double bar graph and answer the questions that follow:
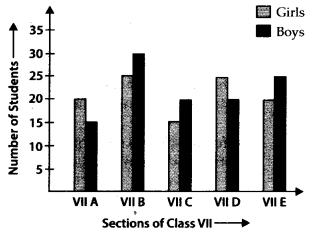
(a) What information does the double bar graph represent?
(b) Find the total number of boys in all sections of Class VII.
(c) in which sections, the number of girls is greater than the number of boys?
(d) In which section, the number of boys is the maximum?
(e) in which section, the number of girls is the least?
Solution:
(a) The double bar graph represents the information about the number of girls and boys in different sections of Class VII
(b) Total number of boys in all sections of Class VIII = 15 + 30 + 20 + 20 + 25 =110
(c) In sections A and D, the number of girls is greater than the number of boys.
(d) In section B, the number of boys is the maximum.
(e) In section C, the number of girls is the least.
Question 82.
In a public library, the following observations were recorded by the librarian in a particular week:
| Days | Newspaper Readers | Magazine Readers |
| Mon | 400 | 150 |
| Tues | 600 | 100 |
| Wed | 350 | 200 |
| Thurs | 550 | 300 |
| Fri | 500 | 250 |
| Sat | 350 | 200 |
(a) Draw a double bar graph choosing an appropriate scale.
(b) On which day, the number of readers in the library was maximum?
(c) What is the mean number of magazine readers?
Solution:
(a)
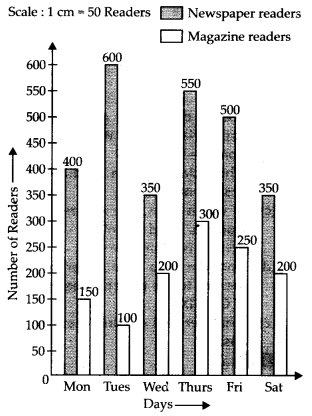
(b) Number of readers on Monday = 400 + 150 = 550
Number of readers on Tuesday = 600 + 100 = 700
Number of readers on Wednesday = 350 + 200 = 550
Number of readers on Thursday = 550 + 300 = 850
Number of readers on Friday = 500 + 250 = 750
Number of readers on Saturday = 350 + 200 = 550
Hence, on Thursday, the number of readers in the library was maximum.
(c) Total number of magazine readers = 150 + 100 + 200 + 300 + 250 + 200 = 1200
\(\therefore \quad \text { Mean }=\frac{1200}{6}=200\)
Question 83.
Observe the following data:
| Government School, Chandpur Daily Attendance Date: 15.4.2009 |
||
| Class | Total Number | Number of Students Present on the Day |
| VI | 90 | 81 |
| VII | 82 | 76 |
| VIII | 95 | 91 |
| IX | 70 | 65 |
| X | 63 | 62 |
(a) Draw a double bar graph choosing an appropriate scale. What do you infer from the bar graph?
(b) Which class has the maximum number of students?
(c) in which class, the difference of total students and the number of students present is minimum?
(d) Find the ratio of the number of students present to the total number of students of Class IX.
(e) What percent of Class VI students were absent?
Solution:
(a)
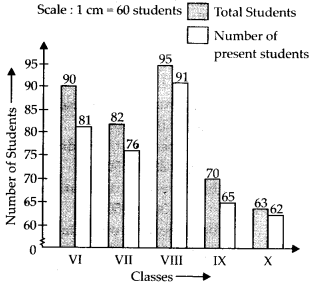
The double bar graph gives information about total number of students and number of students present from Class VI to Class X.
(b) Class VIII has the maximum number of students.
(c) Difference of total students and number of students present in Class VI = 90 – 81 = 9
Difference of total students and number of students present in Class VII = 82 – 76 = 6
Difference of total students and number of students present in Class VIII = 95 – 91 = 4
Difference of total students and number of students present in Class IX = 70 – 65 = 5
Difference of total students and number of students present in Class X = 63 – 62 = 1
Hence, in Class X, the difference of total students and number of students present is minimum.
(d) Total number of students in Class IX = 70
Number of present students in Class IX = 65
∴ Required ratio\(=\frac{65}{70}=\frac{13}{14} \quad i . e,, 13 : 14\)
(e) Total number of students in Class VI = 90
Number of students present in Class VI = 81
∴ Number of students absent in Class VI = 90 – 81 = 9
∴ Percentage of students who were absent\(=\frac{9}{90} \times 100=10 \%\)
Question 84.
Observe the given data:
| Days of the Week | Number of Mobile Phone Sets Sold |
| Mon | 50 |
| Tues | 45 |
| Wed | 30 |
| Thurs | 55 |
| Fri | 27 |
| Sat | 60 |
(a) Draw a bar graph to represent the above given information.
(b) On which day of the week was the sales maximum?
(c) Find the total sales during the week.
(d) Find the ratio of the minimum sale to the maximum sale.
(e) Calculate the average sale during the week.
(f) On how many days of the week was the sale above the average sale?
Solution:
(a)
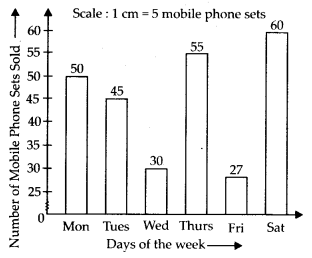
(b) On Saturday, the sales was maximum.
(c) Total sale during the week = 50 + 45 + 30 + 55 + 27 + 60 = 267
(d) Maximum sale = 60
Minimum sale = 27
∴ Required ratio \(=\frac{27}{60}=\frac{9}{20} \text { i.e., } 9 : 20\)
(e) Total sales during the week = 50 + 45 +30 + 55+ 27 +60 = 267
∴ Average sale \(=\frac{267}{6}=44.5\)
(f) Average sale is 44.5.
∴ 4 days of the week i.e., Monday, Tuesday, Thursday and Saturday has the sale above the average sale.
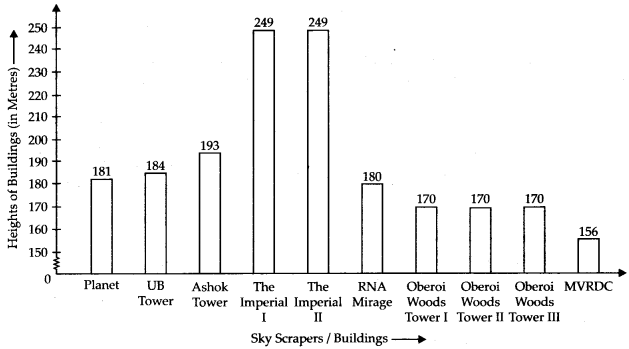
Question 85.
Below is a list of 10 tallest buildings in India. This list ranks buildings in India that stand at least 150 m (492 ft.) tall, based on standard height measurement. This includes spires and architectural details but does not include antenna marks.
Following data is given as per the available information till 2009.
Since new buildings are always under construction, go on-line to check new taller buildings.
Use the information given in the table about skyscrapers to answer the following questions:
| Name | City | Height | Floors | Year |
| Planet | Mumbai | 181 m | 51 | 2009 |
| UB Tower | Bengaluru | 184 m | 20 | 2006 |
| Ashok Tower | Mumbai | 193 m | 49 | 2009 |
| The Imperial 1 | Mumbai | 249 m | 60 | 2009 |
| The Imperial II | Mumbai | 249 m | 60 | 2009 |
| RNA Mirage | Mumbai | 180 m | 40 | 2009 |
| Oberoi Woods Tower 1 | Mumbai | 170 m | 40 | 2009 |
| Oberoi Woods Tower II | Mumbai | 170m | 40 | 2009 |
| Oberoi Woods Tower III | Mumbai | 170 m | 40 | 2009 |
| MVRDC | Mumbai | 156 m | 35 | 2002 |
(a) Find the height of each storey of the three tallest buildings and write them in the following table:
| Building | Height | Number of Storeys | Height of Each Storey |
(b) The average height of one storey for the buildings given in (a) is ______
(c) Which city in this list has the largest percentage of sky scrappers? What is the percentage?
(d) What is the range of data?
(e) Find the median of the data.
(f) Draw a bar graph for given data.
Solution:
(a)
| Building | Height | Number of Storeys | Height of Each Storey |
| The Imperial I | 249 m | 60 | 4.15 m |
| The Imperial II | 249 m | 60 | 4.15 m |
| Ashok Tower | 193 m | 49 | 3.9 m |
(b) Average height of one storey for three tallest buildings
\(=\left(\frac{3.9+4.15+4.15}{3}\right) \mathrm{m}=\frac{12.2}{3} \mathrm{m}=4.06 \mathrm{m}\)
(c) Mumbai has the largest percentage of skys crappers
Total number of sky scrappers = 10
Total number sky scrappers in Mumbai = 9
∴ Percentage of skyscrappers in Mumbai
\(=\frac{9}{10} \times 100=90 \%\)
(d) Range = Highest value – Lowest value
= 249 m – 156 m = 93 m
(e) Arranging the height (inm) in ascending order, we get
156, 170, 170, 170, 180, 181, 184, 193, 249, 249
Since, observations are even in number.
∴ Median = Mean of two middle most observations
\(=\left(\frac{180+181}{2}\right) \mathrm{m}=\frac{361}{2} \mathrm{m}=180.5 \mathrm{m}\)
(f)
Question 86.
The marks out of 100 obtained by Kunal and Soni in the Half Yearly Examination are given below:
| Subjects | Kunal | Soni |
| English | 72 | 86 |
| Hindi | 81 | 89 |
| Maths | 92 | 90 |
| Science | 96 | 82 |
| S. Science | 64 | 75 |
| Sanskrit | 85 | 82 |
(a) Draw a double bar graph by choosing an appropriate scale.
(b) Calculate the total percentage of marks obtained by Soni.
(c) Calculate the total percentage of marks obtained by Kunal.
(d) Compare the percentages of marks obtained by Kunal and Soni.
(e) In how many subjects did Soni get more marks than Kunal? Which are those subjects?
(f) Who got more marks in S. Science and what was the difference of marks?
(g) in which subject the difference of marks was maximum and by how much?
Solution:
(a)
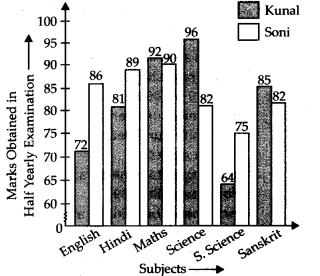
(b) Total marks obtained by Soni = 86 + 89 + 90 + 82 + 75 + 82 = 504
Total maximum marks = 6 × 100=600
∴ Percentage of marks obtained by Soni
\(=\frac{504}{600} \times 100=84 \%\)
(c) Total marks obtained by Kunal = 72 + 81 + 92 +96 + 64 + 85 = 490
Total maximum marks – 6 × 100 = 600
∴ Percentage of marks obtained by Kunal
\(=\frac{490}{600} \times 100=81.6 \%\)
(e) In English, Hindi and S. Science i.e., 3 subjects Soni get more marks than Kunal.
(f) Soni got more marks in S. Science and difference of marks = 75 – 64 = 11
(g) Difference of marks in English = 86 – 72 = 14
Difference of marks in Hindi = 89 – 81 = 8
Difference of marks in Maths = 92 – 90 = 2
Difference of marks in Science = 96 – 82 – 14
Difference of marks in S. Science = 75 – 64 = 11
Difference of marks in Sanskrit = 85 – 82 = 3
Hence, in English and Science, the difference of marks was maximum by 14 marks.
Question 87.
The students of Class VII have to choose one club from Music, Dance, Yoga, Dramatics, Fine arts and Electronics clubs. The data given below shows the choices made by girls and boys of the class. Study the table and answer the questions that follow:
| Clubs | Girls | Boys |
| Music | 15 | 12 |
| Dance | 24 | 16 |
| Yoga | 10 | 8 |
| Dramatics | 19 | 17 |
| Fine Arts | 27 | 11 |
| Electronics | 21 | 30 |
(a) Draw a double bar graph using an appropriate scale to depict the above data.
(b) How many students are there in Class VII?
(c) Which is the most preferred club by boys?
(d) Which is the least preferred club by girls?
(e) For which club the difference between boys and girls is the least?
(f) For which club is the difference between boys and girls the maximum?
Solution:
(a)
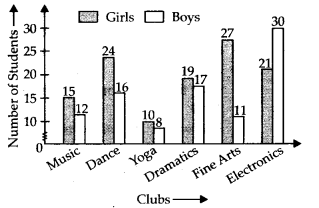
(b) Total number of girls in Class VII = 15 + 24 + 10 + 19 + 27 + 21 = 116
Total number of boys in Class VII = 12 + 16 + 8 + 17 + 11 + 30 = 94
∴ Total number of students in Class VII = 116 + 94 = 210
(c) Electronics club is the most preferred by boys.
(d) Yoga club is the least preferred by girls.
(e) Difference between the number of boys and girls for Music club 15 – 12 = 3
Difference between the number of boys and girls for Dance club = 24 – 16 = 8
Difference between the number of boys and girls for Yoga club = 10 – 8 = 2
Difference between the number of boys and girls for Dramatics club = 19 – 17 = 2
Difference between the number of boys and girls for Fine Arts = 27 – 11 = 16
Difference between the number of boys and girls for Electronics club = 30 – 21 = 9
Hence, for Dramatics club and Yoga club the difference between the number of boys and girls is the least.
(f) For Fine Arts club, the difference between the number of boys and girls is the maximum.
Question 88.
The data given below shows the production of motor bikes in a factory for some months of two consecutive years.
| Months | 2008 | 2007 |
| Feb | 2700 | 2800 |
| May | 3200 | 4500 |
| August | 6000 | 4800 |
| October | 5000 | 4800 |
| December | 4200 | 5200 |
Study the table given above and answer the following questions:
(a) Draw a double bar graph using an appropriate scale to depict the above information and compare them.
(b) In which year was the total output the maximum?
(c) Find the mean production for the year 2007.
(d) for which month was the difference between the production for the two years the maximum?
(e) in which month for the year 2008, the production was the maximum?
(f) In which month for the year 2007, the production was the least?
Solution:
(a)
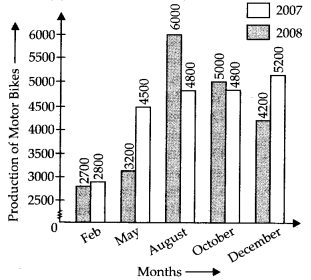
(b) Total output in year 2007 = 2800+ 4500 + 4800 + 4800 + 5200 = 22100
Total output in year 2008 = 2700+ 3200 + 6000 + 5000 + 4200 = 21100
Thus, in year 2007, the total output was the maximum.
(c) Total production for the year 2007 = 22100
∴ Mean production \(=\frac{22100}{5}=4420\)
(d) Difference between the production for February = 2800 – 2700 = 100
Difference between the production for May = 4500 – 3200 = 1300
Difference between the production for August = 6000 – 4800 = 1200
Difference between the production for October = 5000 – 4800 = 200
Difference between the production for December = 5200 – 4200 – 1000
Thus, in the month of May the difference between the production for two years was the maximum.
(e) In the month of August for the year 2008, the production was the maximum.
(f) In the month of February for the year 2007, the production was the least.
Question 89.
The table below compares the population in hundreds) of 4 towns over two years:
| Towns | A | B | C | D |
| 2007 | 2900 | 6400 | 8300 | 4600 |
| 2009 | 3200 | 7500 | 9200 | 6300 |
Study the table and answer the following questions:
(a) Draw a double bar graph using an appropriate scale to depict the above information.
(b) In which town was the population growth maximum?
(c) in which town was the population growth least?
Solution:
(a)
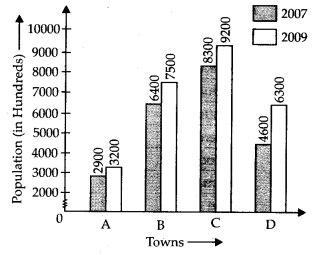
(b) Population growth in town A = 3200 – 2900 = 300
Population growth in town B = 7500 – 6400 = 1100
Population growth in town C = 9200 – 8300 = 900
Population growth in town D = 6300 – 4600 = 1700
Hence, in town the population growth was maximum.
(c) In town A, the population growth was the least.
Question 90.
The table below gives the data of tourists visiting 5 hill stations over two consecutive years. Study the table and answer the questions that follow:
| Hill stations | 2008 | 2009 |
| Nainital | 4000 | 4800 |
| Shimla | 5200 | 4500 |
| Manali | 3700 | 4200 |
| Mussoorie | 5800 | 6200 |
| Kullu | 3500 | 4600 |
(a) Draw a double bar graph to depict the above information using appropriate scale.
(b) Which hill station was visited by the maximum number of tourists in 2008?
(c) Which hill station was visited by the least number of tourists in 2009?
(d) In which hill stations was there increase in number of tourists in the year 2009?
Solution:
(a)
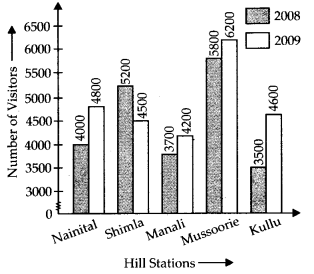
(b) The hill station Mussoorie was visited by the maximum number of tourists in 2008.
(c) The hill station Manali was visited by the least number of tourists in 2009.
(d) In the hill stations Nainital, Manali, Mussoorie and Kullu, there was increase in number of tourists in the year 2009.
Question 91.
The table below gives the flavours of ice cream liked by children (boys and girls) of a society.
| Flavours | Boys | Girls |
| Vanilla | 4 | 8 |
| Chocolate | 9 | 12 |
| Strawberry | 3 | 7 |
| Mango | 8 | 9 |
| Butterscotch | 13 | 10 |
Study the table and answer the following questions:
(a) Draw a double bar graph using an appropriate scale to represent the above information.
(b) Which flavour is liked the most by the boys?
(c) How many girls are there in all?
(d) How many children like the chocolate flavour of ice cream?
(e) Find the ratio of children who like strawberry flavour to vanilla flavour of ice cream.
Solution:
(a)
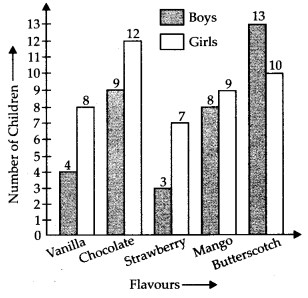
(b) Butterscotch flavour is liked the most by the boys.
(c) Total number of girls = 8 + 12 + 7 + 9 + 10 = 46
(d) Number of girls, like chocolate flavour = 12
Number of boys, like chocolate flavour = 9
Thus, 12 + 9 = 21 children like chocolate flavour of ice cream.
(e) Total number of children who like strawberry flavour = 3 + 7 = 10
Total number of children who like vanilla flavour = 4 + 8 = 12
∴ Required ratio \(=\frac{10}{12}=\frac{5}{6} \quad i . e ., 5 : 6\)
We hope the NCERT Exemplar Class 7 Maths Chapter Chapter 3 Data Handling will help you. If you have any query regarding NCERT Exemplar Class 7 Maths Solutions Chapter 3 Data Handling, drop a comment below and we will get back to you at the earliest.