NCERT Exemplar Class 6 Maths Chapter 5 Data Handling are part of NCERT Exemplar Class 6 Maths. Here we have given NCERT Exemplar Class 6 Maths Solutions Chapter 5 Data Handling.
NCERT Exemplar Class 6 Maths Chapter 5 Data Handling
Directions: In questions 1 to 5, out of the four options, only one is correct. Write the correct answer.
Question 1.
Using tally marks, which one of the following represents the number eight:
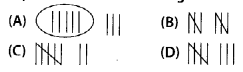
Solution:
(D) : 8 can be represented as ![]()
Question 2.
The marks (out of 10) obtained by 28 students in a Mathematics test are listed as below:
8, 1, 2, 6, 5, 5, 5, 0, 1, 9, 7, 8, 0, 5, 8, 3, 0, 8, 10, 10, 3, 4, 8, 7, 8, 9, 2, 0
The number of students who obtained marks more than or equal to 5 is
(A) 13
(B) 15
(C) 16
(D) 17.
Solution:
(D) : The number of students who obtained marks more than or equal to 5 is 17.
Question 3.
In question 2 above, the number of students who scored marks less than 4 is
(A) 15
(B) 13
(C) 12
(D) 10
Solution:
(D) : The number of students who scored marks less than 4 is 10.
Question 4.
The choices of the fruits of 42 students in a class are as follows:
A, O, B, M, A, G, B, G, A, G,
B, M, A, G, M, A, B, G, M, B,
A, O, M, O, G, B, 0, M, G, A,
A, B, M, O, M, G, B, A, M, O, M, O,
where A, B, G, M and O stand for the fruits Apple, Banana, Grapes, Mango and Orange respectively.
Which two fruits are liked by an equal number of students?
(A) A and M
(B) MandB
(C) B and O
(D) B and G
Solution:
(D) : We have given two fruits Banana and Grapes, which are liked by an equal number of students i.e., 8.
Question 5.
According to data of question 4, which fruit is liked by most of the students?
(A) O
(B) G
(C) M
(D) A
Solution:
(C) : Mango is the only fruit which is liked by most of the students.
Directions: In questions 6 to 13, state whether the given statements are true (T) or false (F).
Question 6.
In a bar graph, the width of bars may be unequal.
Solution:
False
In a bar graph, bars have equal width.
Question 7.
In a bar graph, bars of uniform width are drawn vertically only.
Solution:
False
In a bar graph, bars of uniform width can be drawn vertically as well as horizontally.
Question 8.
In a bar graph, the gap between two consecutive bars may not be the same.
Solution:
False
In a bar graph, the gap between two consecutive bars should be same.
Question 9.
In a bar graph, each bar (rectangle) represents only one value of the numerical data.
Solution:
True
Question 10.
To represent the population of different towns using bar graph, it is convenient to take one unit length to represent one person.
Solution:
False
Question 11.
Pictographs and bar graphs are pictorial representations of the numerical data.
Solution:
True
Question 12.
An observation occurring five times in a data is recorded as ![]() using tally marks.
using tally marks.
Solution:
False
Using tally marks, the occurrence of any observation five times can be represented as ![]()
Question 13.
Solution:
True
Directions: In questions 14 to 21, fill in the blanks to make the statements true.
Question 14.
A ____ is a collection of numbers gathered to give some meaningful information.
Solution:
Data
Question 15.
The data can be arranged in a tabular form using ____ marks.
Solution:
Tally
Question 16.
A ____ represents data through pictures of objects.
Solution:
Pictograph
Question 17.
In a bar graph, ____ can be drawn horizontally or vertically.
Solution:
Bars
Question 18.
In a bar graph, bars of ____ width can be drawn horizontally or vertically with ____ spacing between them.
Solution:
Uniform, Equal
Question 19.
An observation occurring seven times in a data is represented as ___ using tally marks.
Solution:
![]()
Question 20.

Solution:
60
Question 21.
On the scale of 1 unit length = 10 crore, the bar of length 6 units will represent ____ crore and of ___ units will represent 75 crore.
Solution:
60, 7.5
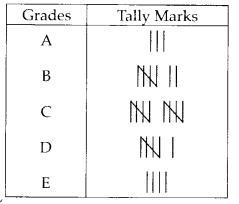
Question 22.
In an examination, the grades achieved by 30 students of a class are given below. Arrange these grades in a table using tally marks:
B, C, C, E, A, C, B, B, D, D, D, D, B, C, C, C, A, C, B, E, A, D, C, B, E, C, B, E, C, D
Solution:
Question 23.
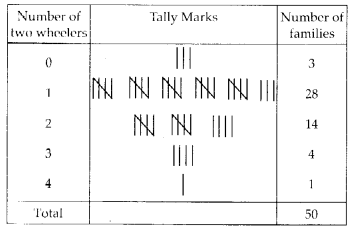
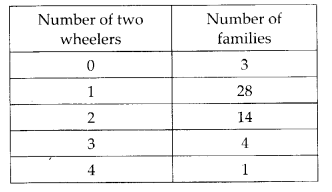
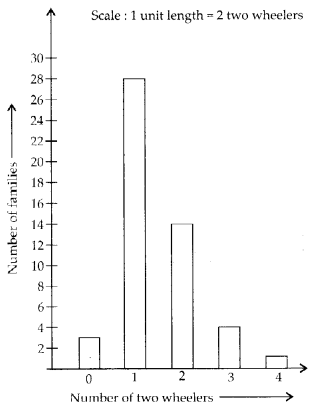
The number of two wheelers owned individually by each of 50 families are listed below. Make a table using tally marks.
1, 1, 2, 1, 1, 1, 2, 1, 2, 1, 0, 1, 1, 2, 3, 1, 2, 1, 1, 2, 1, 2, 3, 1, 0, 2, 1, 0, 2, 1, 2, 1, 2, 1, 1, 4, 1, 3, 1, 1, 2, 1, 1, 1, 1, 2, 3, 2, 1, 1
Find the number of families having two or more, two wheelers.
Solution:

So, 14 + 4 + 1 = 19 families have two or more, two wheelers.
Question 24.
The lengths in centimetres (to the nearest centimetre) of 30 carrots are given as follows:
15, 22, 21, 20, 22, 15, 15, 20, 20,15, 20, 18, 20, 22, 21, 20, 21, 18, 21, 18, 20, 18, 21, 18, 22, 20, 15, 21, 18, 20
Arrange the data given above in a table using tally marks and answer the following questions.
(a) What is the number of carrots which have length more than 20 cm?
(b) Which length of the carrots occur maximum number of times? Minimum number of times?
Solution:
(a) The number of carrots which have length more than 20 cm is 6 + 4 = 10.
(b) The carrots of the length 20 cm occur maximum number of times and the carrots of the length 22 cm occur minimum number of times.
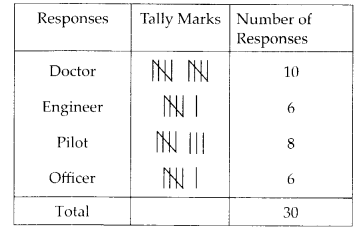
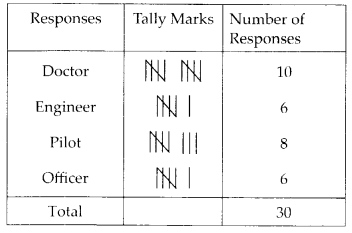
Question 25.
Thirty students were interviewed to find out what they want to be in future. Their responses are listed as below:
doctor, engineer, doctor, pilot, officer, doctor, engineer, doctor, pilot, officer, pilot, engineer, officer, pilot, doctor, engineer, pilot, officer, doctor, officer, doctor, pilot, engineer, doctor, pilot, officer, doctor, pilot, doctor, engineer
Arrange the data in a table using tally marks.
Solution:
Question 26.
Following are the choices of games of 40 students of Class VI:
football, cricket, football, kho-kho, hockey, cricket, hockey, kho-kho, tennis, tennis, cricket, football, football, hockey, kho-kho, football, cricket, tennis, football, hockey, kho- kho, football, cricket, cricket, football, hockey, kho-kho, tennis, football, hockey, cricket, football, hockey, cricket, football, kho-kho, football, cricket, hockey, football.
(a) Arrange the choices of games in a table using tally marks.
(b) Which game is liked by most of the students?
(c) Which game is liked by minimum number of students?
Solution:
(a)
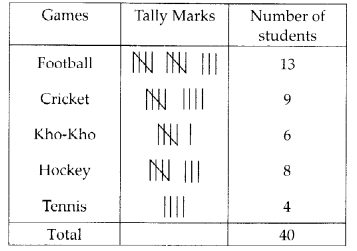
(b) Football is liked by most of the students.
(c) Tennis is liked by minimum number of students.
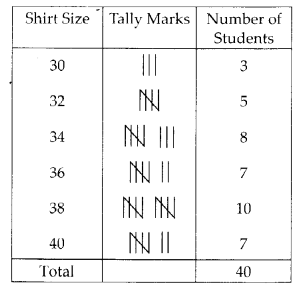
Question 27.
Fill in the blanks in the following table which represents shirt size of 40 students of a school.
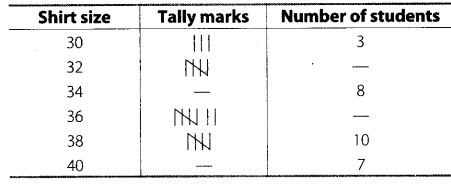
Solution:
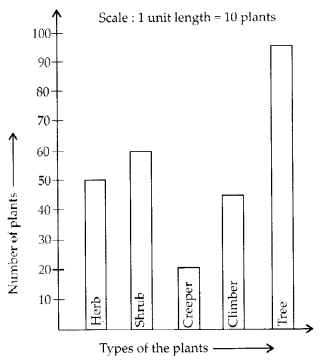
Question 28.
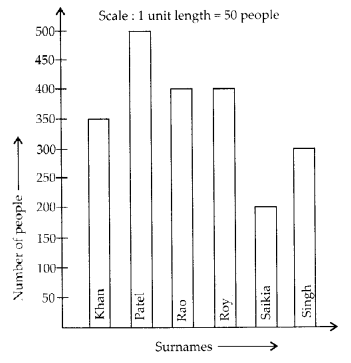
Following pictograph represents some surnames of people listed in the telephone directory of a city

Observe the pictograph and answer the following questions:
(a) How many people have surname ‘Roy’?
(b) Which surname appears the maximum number of times in the telephone directory?
(c) Which surname appears the least number of times in the directory?
(d) Which two surnames appear an equal number of times?
Solution:
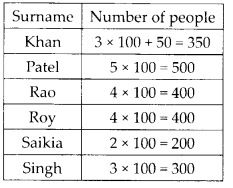
(a) 400 people have surname ‘Roy’.
(b) The surname ‘Patel’ appears the maximum number of times in the telephone directory.
(c) The surname ‘Saikia’ appears the least number of times in the telephone directory.
(d) The surnames ‘Rao’ and ‘Roy’ appear an equal number of times.
Question 29.
Students of Class VI in a school were given a task to count the number of articles made of different materials in the school. The information collected by them is represented as follows:
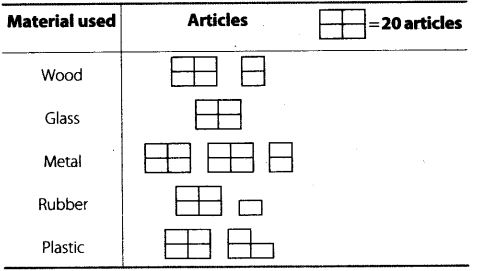
Observe the pictograph and answer the following questions:
(a) Which material is used in maximum number of articles?
(b) Which material is used in minimum number of articles?
(c) Which material is used in exactly half the number of articles as those made up of metal?
(d) What is the total number of articles counted by the students?
Solution:
(a) Metal is used in maximum number of articles.
(b) Glass is used in minimum number of articles.
(c) Rubber is used in exactly half the number of articles as those made up of metal.
(d) The total number of articles counted by the students is 160.
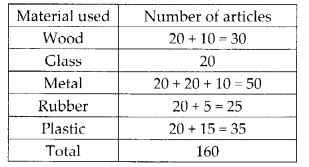
Question 30.
The number of scouts in a school is depicted by the following pictograph:
Observe the pictograph and answer the following questions:
(a) Which class has the minimum number of scouts?
(b) Which class has the maximum number of scouts?
(c) How many scouts are there in Class VI?
(d) Which class has exactly four times the scouts as that of Class X?
(e) What is the total number of scouts in the Classes VI to X?
Solution:
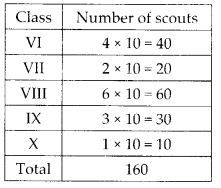
(a) Class X has minimum number of scouts.
(b) Class VIII has maximum number of scouts.
(c) There are 40 scouts in Class VI.
(d) Class VI has exactly four times the scouts as that of Class X.
(e) Total number of scouts in the Classes VI to X is 160.
Question 31.
A survey was carried out in a certain school to find out the popular school subjects among students of Classes VI to VIII. The data in this regard is displayed as pictograph given below:
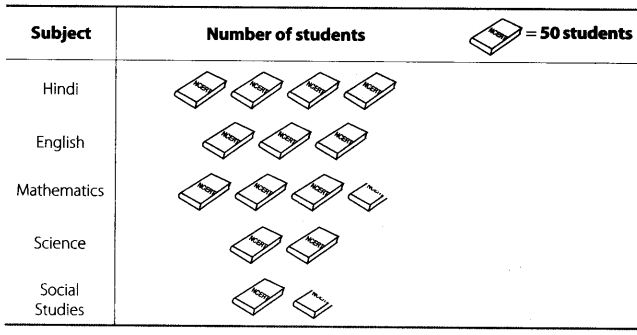
(a) Which subject is most popular among the students ?
(b) How many students like Mathematics ?
(c) Find the number of students who like subjects other than Mathematics and Science
Solution:
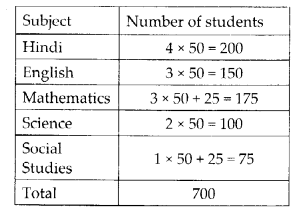
(a) Hindi is the most popular subject among the students.
(b) 175 students like Mathematics.
(c) Total 200 + 150 + 75 = 425 students are there who like subjects other than Mathematics and Science.
Question 32.
The following pictograph depicts the information about the areas in sq km (to nearest hundred) of some districts of Chhattisgarh State:
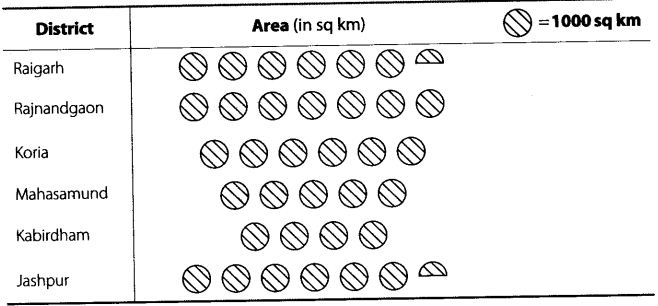
(a) What is the area of Koria district?
(b) Which two districts have the same area?
(c) How many districts have area more than
Solution:
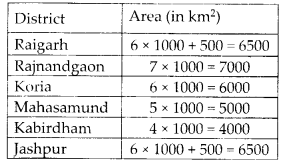
(a) The area of Koria district is 6000 sq km.
(b) Raigarh and Jashpur districts have the same area of 6500 sq km.
(c) There are 4 districts who have area more than 5000 square kilometres and they are Raigarh, Rajnandgaon, Koria and Jashpur.
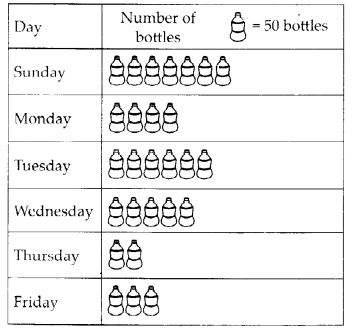
Question 33.
The number of bottles of cold drinks sold by a shopkeeper on six consecutive days is as follows:
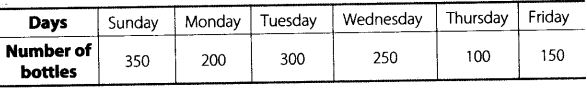
Prepare a pictograph of the data using one symbol to represent 50 bottles
Solution:
Question 34.
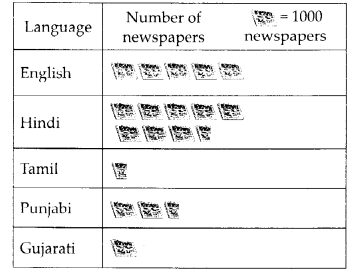
The following table gives information about the circulation of newspapers (dailies) in a town in five languages.
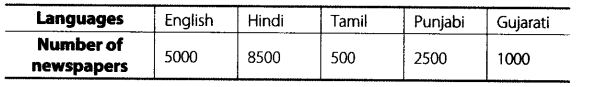
Prepare a pictograph of the above data, using a symbol of your choice, each representing 1000 newspapers.
Solution:
Question 35.
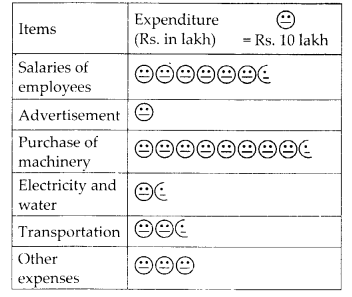
Annual expenditure of a company in the year 2007-2008 is given below:
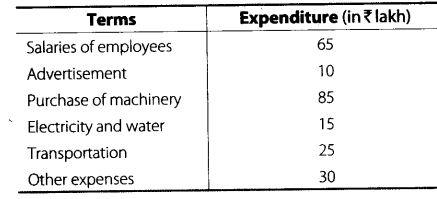
Prepare a pictograph of the above data using an appropriate symbol to represent Rs. 10 lakh.
Question 36.
The following bar graph shows the number of houses (out of 100) in a town using different types of fuels for cooking.
Read the bar graph and answer the following questions:
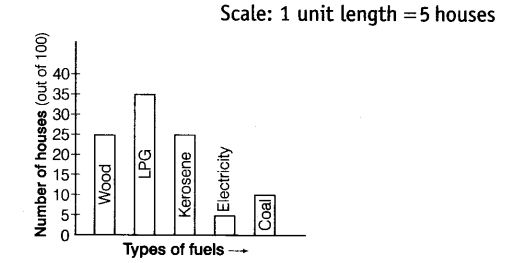
(a) Which fuel is used in maximum number of houses?
(b) How many houses are using coal as fuel?
(c) Suppose that the total number of houses in the town is 1 lakh.
From the above graph estimate the number of houses using electricity.
Solution:
(a) LPG is used in maximum number of houses.
(b) 10 houses are using coal as fuel.
(c) Since, there are 5 houses using electricity out of 100. Therefore, out of 1 lakh the electricity will be used by \(\frac{5}{100} \times 100000\)
= 5000 houses.
Question 37.
The following bar graph represents the data for different sizes of shoes worn by the students in a school. Read the graph and answer the following questions.
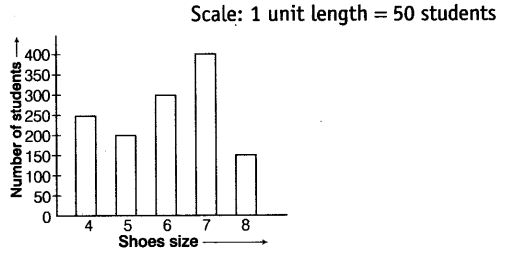
(a) Find the number of students whose shoe sizes have been collected.
(b) What is the number of students wearing shoe size 6?
(c) What are the different sizes of the shoes worn by the students?
(d) Which shoe size is worn by the maximum number of students?
(e) Which shoe size is worn by minimum number of students?
(f) State whether true or false:
The total number of students wearing shoe sizes 5 and 8 is the same as the number of students wearing shoe size 6.
Solution:
(a) The total number of students whose shoe sizes have been collected = 250 + 200 + 300 + 400 + 150 = 1300
(b) The number of students wearing shoe size 6 is 300.
(c) The different sizes of the shoes worn by the students are 4, 5, 6, 7 and 8.
(d) The shoe size 7 is worn by the maximum number of students.
(e) The shoe size 8 is worn by the minimum number of students.
(f) False: Since, the number of students wearing shoe size 5 and 8 is 350 and the number of students wearing shoe size 6 is 300.
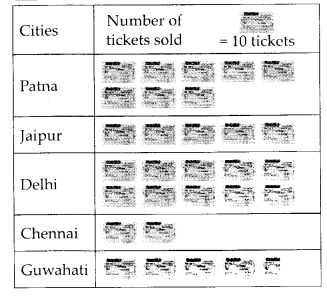
Question 38.
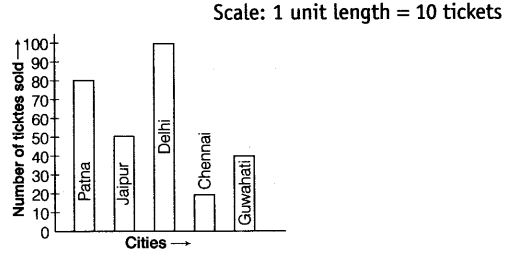
The following graph gives the information about the number of railway tickets sold for different cities on a railway ticket counter between 6.00 am to 10.00 am. Read the bar graph and answer the following questions.

(a) How many tickets were sold in all?
(b) For which city were the maximum number of tickets sold?
(c) For which city were the minimum number of tickets sold?
(d) Name the cities for which the number of tickets sold is more than 20.
(e) Fill in the blanks:
Number of tickets sold for Delhi and Jaipur together exceeds the total number of tickets sold for Patna and Chennai by ____.
Solution:
(a) Total number of tickets sold = 80 + 50 + 100 + 20 + 45 = 295
(b) The maximum number of tickets were sold for Delhi.
(c) The minimum number of tickets were sold for Chennai.
(d) The cities for which the number of tickets sold is more than 20 are as follows :
Patna, Jaipur, Delhi and Guwahati.
(e) 50 : Number of tickets sold for Delhi and Jaipur together = 100 + 50 = 150.
Number of tickets sold for Patna and Chennai together = 80 + 20 = 100.
Therefore, tickets sold for Delhi and Jaipur exceeds the tickets sold for Patna and Chennai by 150 – 100 = 50.
Question 39.
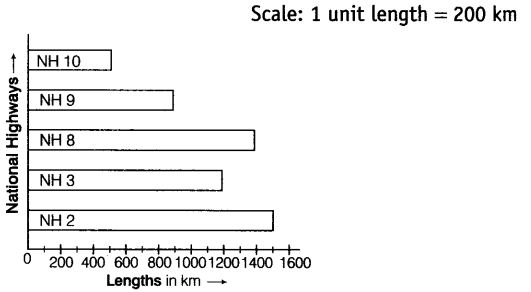
The bar graph given below represents approximate length (in kilometres) of some National Highways in India. Study the bar graph and answer the following questions:

(a) Which National Highway (N.H.) is the longest among the above?
(b) Which National Highway is the shortest among the above?
(c) What is the length of National Highway 9?
(d) Length of which National Highway is about three times the National Highway 10?
Solution:
(a) The longest National Highway is N.H. 2.
(b) The shortest National Highway is N.H. 10.
(c) The length of National Highway 9 is 900 km.
(d) Length of National Highway 10 = 450 km
Length of National Highway 8 = 1400 km
So, length of National Highway 8 is about three times the National Highway 10.
Question 40.
The bar graph given below represents the circulation of newspapers in different languages in a town. Study the bar graph and answer the following questions:
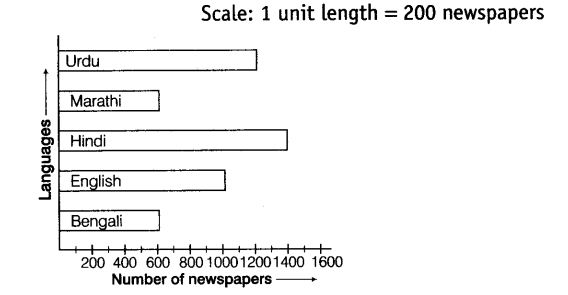
(a) What is the circulation of English newspaper?
(b) Name the two languages in which circulation of newspaper is the same.
(c) By how much is the circulation of newspaper in Hindi more than the newspaper in Bengali?
Solution:
(a) The circulation of English newspaper is 1000.
(b) In Bengali and Marathi languages the circulation of newspaper is the same.
(c) The circulation of newspaper in Hindi is more than the newspaper in Bengali by 1400 – 600 = 800
Question 41.
Read the bar graph given below and answer the following questions:
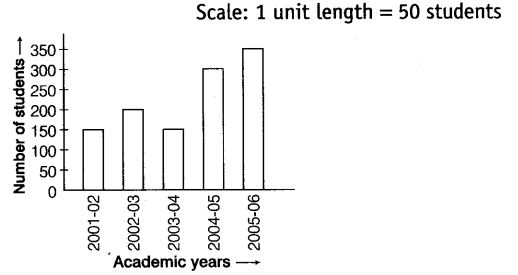
(a) What information is given by the bar graph?
(b) In which year is the number of students maximum?
(c) In which year is the number of students twice as that of 2001 -02?
(d) In which year did the number of students decrease as compared to previous year?
(e) In which year is the increase in number of students maximum as compared to the previous year?
Solution:
(a) The given bar graph shows the number of students in different academic years.
(b) In the year 2005-06, the number of students is maximum.
(c) Since, number of students in 2001-02 is 150 and number of students in 2004-05 is 300.
So, in the year 2004-05, the number of students is twice as that of 2001-02.
(d) The year is 2003-04 in which the number of students decreased as compared to previous year.
(e) The year is 2004-05 in which the increase in number of students is maximum as compared to the previous year.
Question 42.
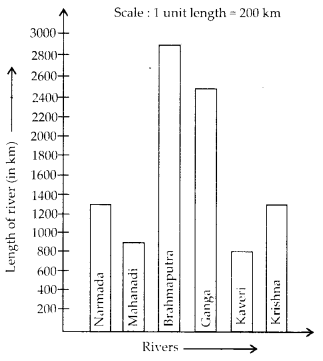
The lengths in km (rounded to nearest hundred) of some major rivers of India is given below:
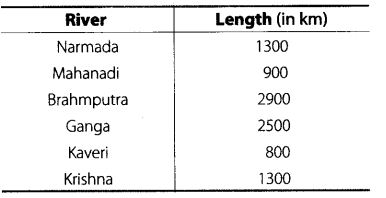
Draw a bar graph to represent the above information.
Solution:
Question 43.
The lengths in km (rounded to nearest hundred) of some major rivers of India is given below:
Draw a bar graph to represent the above information by choosing the scale of your choice.
Solution:
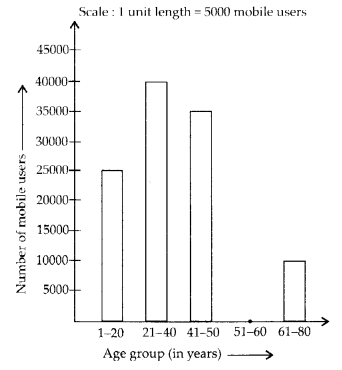
Question 44.
Number of mobile phone users in various age groups in a city is listed below:
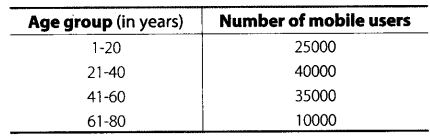
Draw a bar graph to represent the above information
Solution:
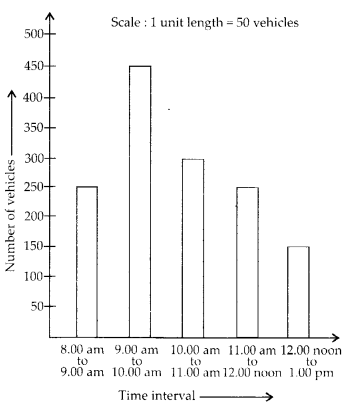
Question 45.
The following table gives the number of vehicles passing through a toll gate, every hour from 8.00 am. to 1.00 pm:
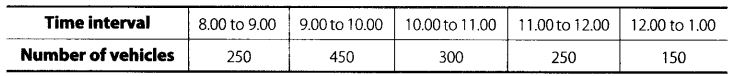
Draw a bar graph representing the above data.
Solution:
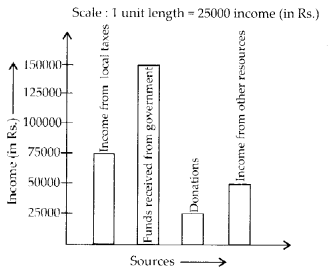
Question 46.
The following table represents income of a Gram Panchayat from different sources in a particular year:
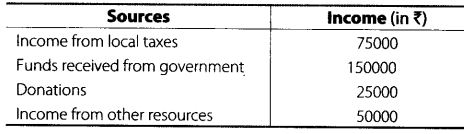
Draw a bar graph to represent the above information.
Solution:
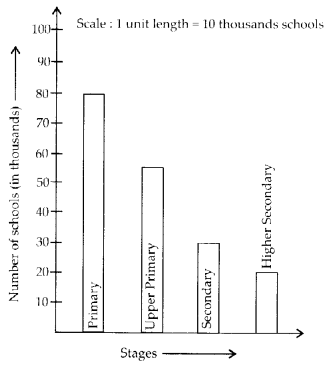
Question 47.
The following table gives the data of number of schools (stage-wise) of a country in the year 2002.
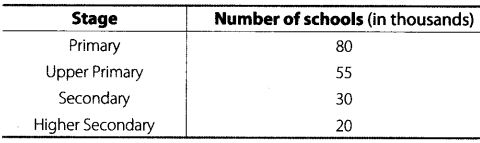
Draw a bar graph to represent the above information.
Solution:
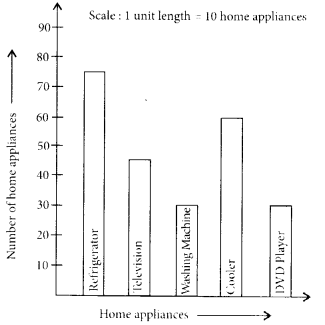
Question 48.
Home appliances sold by a shop in one month are given as below:
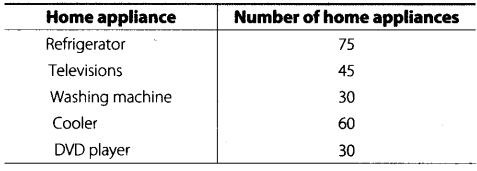
Solution:
Question 49.
In a botanical garden, the number of different types of plants are found as follows:
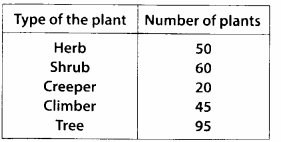
Draw a bar graph to represent the above information and answer the following questions:
(a) Which type of plant is maximum in number in the garden?
(b) Which type of plant is minimum in number in the garden?
Solution:
Question 50.
prepare a bar graph of the data given in
Solution:
Question 51.
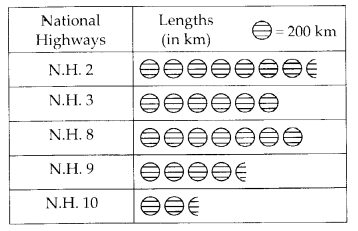
Prepare a pictograph of the data by taking a suitable symbol to represent 200 kilometers.
Solution:
Question 52.
Prepare a pictograph of the information given in
Solution:
Question 53.
Prepare a bar graph of the data.
Solution:
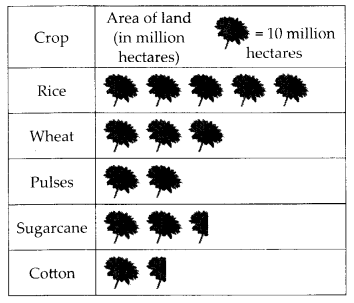
Question 54.
The following table shows the area of the land on which different crops were grown.
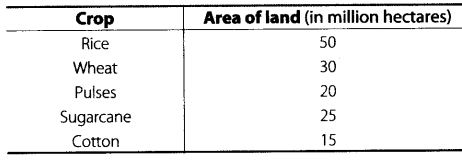
prepare a pictograph by choosing a suitable symbol to represent 10 million hectares.
Solution:
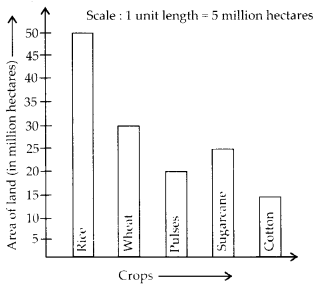
Question 55.
Refer to question 54. Prepare a bar graph of the data.
Solution:
We hope the NCERT Exemplar Class 6 Maths Chapter 5 Data Handling will help you. If you have any query regarding NCERT Exemplar Class 6 Maths Solutions Chapter 5 Data Handling, drop a comment below and we will get back to you at the earliest.