Geography Class 12 Important Questions Chapter 11 Population: Distribution, Density, Growth and Composition is part of Geography Class 12 Important Questions. Here we have given Geography Class 12 Important Questions Chapter 11 Population: Distribution, Density, Growth and Composition.
Geography Class 12 Important Questions Chapter 11 Population: Distribution, Density, Growth and Composition
1 Mark Questions
Question 1.
Name the state of India with the largest area. (Delhi, All India 2016)
Answer:
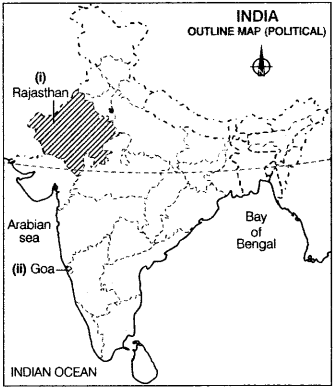
The largest state of India in terms of area in Rajasthan with an area of about 342,239 sq km.
Question 2.
Name the Union Territory of Indian having the lowest density of population as per 2011 census. (Delhi 2016)
Answer:
As per census 2011, the least densely populated Union Territory of India is Andaman and Nicobar Islands with a density of 46 persons/sq km.
Question 3.
Define the term ‘population distribution. (Delhi 2015)
Answer:
Population distribution is the term which means the spread of people across the world, i.e. where do people live.
Question 4.
How is the density of population of a region calculated? (AH India 2015)
OR
Define the term density of population. (Delhi 2012)
Answer:
Population density is the ratio of people per unit area. It is usually measured in per sq km or sq mile. Generally, this may be calculated for a country, city, or another territory of the world.
Question 5.
Who are the ‘marginal workers in India’? (AH Indio 2014)
Answer:
In India, a marginal worker is referred to as a person who works for less than 183 days in a year and the rest of days they have no work.
Question 6.
Mention any two causes of the negative growth rate of population in India during (1911-21). (Delhi 2013)
Answer:
The two causes responsible for the negative growth rate of the population are:
- High birth rate and high death rate.
- Lack of medical facilities, family planning, etc.
Question 7.
What is the density of population of India according to the 2011 census? (Delhi 2013)
Answer:
According to census 2011, the density of population of India is 382 persons per sq km.
Question 8.
According to the census which the state of India having the highest density of population and also mention its density. (Delhi 2009)
Answer:
According to Census 2001, the state has the highest density of population in India is West Bengal with an average density of 904 persons per sq km. But according to 2011 census, Bihar state having the highest density of population with 1106 sq km, West Bengal stands at second with 1028 sq km of its density.
Question 9.
Which age group of the population indicates the largest working population? (All Indio 2008)
Answer:
The age group of 15-59 years indicates the largest working group of the population.
3 Marks Questions
Question 10.
What is the main thrust of the National Youth Policy of Government of India 2003? (All India 2016)
Answer:
The National Youth Policy, 2003 reiterates the commitment of the entire nation to the composite and all-round development of the young sons and daughters of India and seeks to establish an All-India perspective to fulfil their legitimate aspirations.
The main thrust of the policy are:
- To provide the youth with proper education and training opportunities and to facilitate access to information in respect of employment opportunities and to other services.
- To sustain and reinforce the spirit of volunteerism amongst the youth in order to build up individual character and generate a sense of commitment to the goals of developmental programmes.
Question 11.
“The decades 1951-81 are referred to as the period of population explosion in India.” Explain the statement by giving three reasons, (AH India 2014)
OR
Explain any five causes of the rapid growth of population in India from 1951 to 1981. (All India 2011)
Answer:
The decades of 1951-81 are referred to as the period of population explosion in India because of a rapid fall in death rate and high birth rate. The main causes of this explosion are as follows:
Widening Gap between Birth and Death Rates The average annual birth rate was 42 per thousand population but it came down to 28.7 per thousand in 1981. This shows that the birth rate has shown small decline and death rate has gone down rather sharply. This widening gap has increased our population rapidly.
Low Age of Marriage Child marriage has been very common in our country. As per census report, 72% marriage in India was performed before 15 and 34% before 10 years of age. The mean age at marriage of females increased from 15.6 in 1951 to 17.6 in 1981.
High Illiteracy During this period (1951-81), the overall literacy rate was very low. Due to this, they would be more orthodox, illogical and religious minded.
Religious Attitude towards Family Planning The religiously orthodox and conservative people are against the use of family planning measures. The women disfavoured family planning on the plea that they cannot go against the wishes of God.
Other Causes Joint family system and lack of responsibility of young couples in these families to bring up their children and lack of recreational facilities, and lack of information or wrong information about the adverse effects of vasectomy, tubectomy are some other causes of the rapid growth of population.
Question 12.
Explain any five causes for the stagnant growth of India’s population from 1901 to 1921. (All India 2014, 11)
Answer:
The period from 1901-1921 is referred to as a period of the stagnant or stationary phase of growth of India’s population. The following causes were responsible for the stagnant growth of India’s population from 1901 to 1921:
- High birth rate and high death rate resulted in stationary growth.
- Lack of medical health and sanitation facilities.
- Improper public distribution system.
- A lower level of economic development reduced migration.
- Illiteracy, lack of family planning and social awareness.
Question 13.
Explain the main aspects of the ‘National Youth Policy’ of Government of India launched in 2003. (AH India 2014)
Answer:
The National Youth Policy has been launched by the government in 2003 in view of challenges against the adolescent population.
Major aspects of this policy are as follows:
- Channelisation and proper utilisation of adolescents by giving them proper education. To impart education to the adolescent group so that their talent and potential arc better analysed and properly utilized.
- Imparting skill quality.
- All round development of the youth is to be undertaken.
- Empowering women and girls child to bring equality in the male and female status.
- Providing youth health facilities make them creative, aware and innovative in the field of science and technology.
Question 14.
Which are the two main components of population growth in India? Describe the main feature of each component. (Delhi 2009)
Answer:
The two main components of population growth in India are:
Natural Growth It refers to the growth in population which is caused by birth rate and death rate. It is estimated by the difference between birth rate and death rate.
Characteristics of natural growth are as under:
- In India, growth is more influential in population growth.
- This growth rate shows the medical, technological and social advancement of society.
Induced Growth Rate Induced growth refers to the growth in population caused by the migration. It is measured by the difference between migrants and out-migrants.
Characteristics of induced growth rate are as under:
- In India, it is more influential in population growth during partition in 1947 and Bangladesh War of 1971.
- This type of growth is caused by the economic advancement of a society that attracts migrants from other areas.
Question 15.
Explain the spatial distribution of population density in India, (AH India 2009)
Answer:
The spatial distribution of population density in India shows a very uneven pattern. It ranges from the lowest 13 persons per sq km in Arunachal Pradesh to 9294 people per sq km in Delhi.
The density of population is very high in states of Northern Plains i.e. Bihar (1106), West Bengal (1028), and Uttar Pradesh (829). Among the Southern States, Kerala (860) and Tamil Nadu have higher densities of population.
Some Indian states like Assam, Gujarat, Andhra Pradesh, Haryana, Jharkhand, Odisha and others have moderate densities as compared to other states. Most of the hilly states and regions having extreme climates have low density. Among them, North-Eastern states except Assam are important.
Question 16.
Which are the three groups of Indian population according to their economic status? Explain the main characteristics of each group. (Delhi 2008)
Answer:
On the basis of economic status, India’s population is divided into the following three categories:
Main Workers A person who works for at least 183 days in a year.
Characteristics of the main workers are as follows:
- They are the main contributors to a nation’s GDP.
- They constitute a large proportion of workers in India.
Marginal Workers A person who works for less than 183 days in a year.
Characteristics of marginal workers are as follows:
- They are mostly engaged in the agricultural sector.
- They constitute a short proportion of workers in India.
Non-Worker A person who does not work for his livelihood.
Characteristics of non-workers are as follows:
- They are dependent on the working population for their needs.
- They represent a larger proportion of the Indian population.
This indicates an economic status in which there is a larger proportion of the dependent population, further indicating the possible existence of a large number of unemployed or underemployed people.
5 Marks Questions
Question 17.
“ An uneven distribution of population suggests a close relationship between population and physical and socioeconomic factors”. Support the statement with suitable examples. (All India 2017)
OR
Explain with examples any five factors that affect the population distribution in India. Delhi 2011
Answer:
The spatial pattern of distribution of the population in India is very uneven. The factors responsible for this uneven distribution are physical and economic.
Physical factors that affect the population distribution are:
- People prefer to live in fertile plain as compared to hilly or mountainous areas. That’s why Northern plains, deltas, coastal plains have a higher proportion of the population than some other parts of the country.
- People usually prefer to live in areas having a pleasant climate. Coastal plains are a highly preferable place for people to live, for e.g. Southern parts of India. Whereas hilly and desert lands have relatively lower population due to extreme climatic conditions, for e.g. North-Eastern states and Rajasthan desert areas.
- Availability of water is also a responsible factor for people to live. Generally, in ancient times most of the civilisation flourished near river banks. For e.g. Indus Valley Civilisation, Mesopotamian Civilization.
- Availability of natural resources also attracts people to live and develop their livelihood there.
Economic factors that affect the population distribution are:
- Settled agriculture and agricultural development, a pattern of human settlement, all are the main attraction of human being. For e.g. the Northern Plains of India are densely populated regions.
- Industrialisation and urbanisation are the pull factors to attract people to move there like, Delhi, Mumbai, Kolkata, Bengaluru, Chennai and Jaipur.
- A good network of transportation also gives rise to population growth in an area which facilitates people to easily move from one place to another.
- Presence of mineral resources is also a factor which attracts industrialisation and ultimately urbanisation, for e.g. Chotanagpur Plateau region.
Question 18.
What is the density of population? Describe the spatial variation of population density in India. (Delhi 2015)
Answer:
It is referred to as a number of persons per unit area. It helps in getting a better understanding of the spatial distribution of the population in relation to land. Spatial variation of population density in India is as follows:
- The census data 2011 gives an idea of spatial variation of population densities in the country which ranges from as low as 17 persons per sq km in Arunachal Pradesh to 11.297 people per sq km in the National Capital Territory of Delhi.
- Among the Northern Indian states, Bihar (1106 highest), West Bengal (1028) and Uttar Pradesh (829), have higher densities while Kerala (860), Tamil Nadu (555) and Goa (394) have higher densities among peninsular Indian states.
- States like Haryana, Punjab, Jharkhand and Assam have moderate densities.
- The mountainous region (The Himalayas) excluding Assam have relatively lower densities, e.g. Arunachal Pradesh (17 lowest), Mizoram (52), Jammu and Kashmir (56), Sikkim (86) and Nagaland (119).
Question 19.
What is the source of population data in India? Explain the distribution of population in India. (Delhi 2015)
Answer:
In India, Population data is collected through census operation which held every 10 years in our country. The spatial pattern of population distribution is very uneven. As some areas are sparsely populated whereas others are dense. These states can be categorised into three categories:
States with High Population Uttar Pradesh, (highest population), Maharashtra, Bihar, West Bengal, Andhra Pradesh, Tamil Nadu, Madhya Pradesh, Rajasthan,
Karnataka and Gujarat. These states together account for 76% of the population.
States with Moderate population Assam, Haryana, Jharkhand, Chhattisgarh, Kerala, Punjab, Goa.
States with Low population Hilly and tribal areas like Jammu and Kashmir, Uttarakhand, all North Eastern states (except Assam) and Union Territories excluding Delhi.
The population is mainly affected by climate, terrain and availability of water. For example, the North Indian Plains, deltas and coastal plains are densely populated, whereas the mountainous areas and interior areas of central and southern India have relatively low population.
Besides these, the evolution of settled and urbanisation are the socio-economic and historical factors of distribution of population.
Question 20.
Define the term ‘growth of population’. Describe the third (III) phase of growth of population in India. (All Indio 2015)
Answer:
Growth of population refers to the changes occurring in the number of a person living in a particular area between two points of time. The growth rate is expressed in percentage. The third phases of population growth are described below:
- Its period is from 1951 to 1981.
- This period is well-known for the population of the explosion in the country.
- The situation of population explosion is caused by a rapid fall in mortality rate but a high fertility rate of population in India.
- In this decade, the average annual growth rate was as high as 2.2%, due to improved and planned developmental activities.
- The high growth rate was also a result of increased international migration from countries like Tibet, Bangladesh, Nepal and Pakistan.
Question 21.
What is the population doubling time? Explain the characteristics of the growth of population in India in Phase-I and phase-II. (All India 2015)
Answer:
Population doubling time is the time taken by any population to double itself at its current annual growth rate.
Characteristics of the growth of population in India in phase-I are given below:
- The period of phase-I is from 1901 to 1921.
- This period is considered a stagnant phase of growth.
- During 1911-1921, this period has recorded a very low growth rate, even recording a negative growth rate.
- In this period, the rate of increase was low due to both high birth rate and death rate.
Characteristics of the growth of population in India in phase-II are given below:
- Its period is from 1921 to 1951.
- This period is known for steady population growth.
- In this period, India has recorded an overall improvement in health and sanitation which brought down the mortality rate.
- The crude birth rate remained high in this phase leading to a higher growth rate than the previous phase.
Question 22.
The decades of 1921-51 are referred to as the period of a steady growth of population whereas the decades 1951-81 are referred to as the period of population explosion in India. Explain by giving reasons. (Delhi 2014)
OR
Why has the population of India been increasing steadily in the period of 1921-51? Explain any three reasons. (All Indio 2012)
OR
Def.ne the terms growth of population. Explain any four causes for the steady growth of population in India during decades of (1921-51. Delhi 2011)
Answer:
Growth of population refers to the change occurring in the number of persons living in an area between two points of time.
The second phase of population growth in India is from 1921 to 1951. This phase is known as the steady phase of India’s population growth because of the following reasons:
- High birth rate and declining mortality rate.
- Improvement in medical, sanitation facilities and health services.
- The crude birth rate remained high in this period.
- Better transport system which led to the improved distribution system.
The third phase of population growth is from 1951 to 1981 because of the rapid fall in the mortality rate and a high fertility rate or birth rate in the country. This phase is also known as the phase of population explosion because of the following reasons:
- The population increased with a high growth rate. The average annual growth rate in this phase was 2.2 percent.
- The population increased because of the starting of developmental activities by the centralised planning process that led to the economic development and improvement in the living conditions of the people at large.
- Another reason responsible for population increase was migration from Tibet, Bangladesh, Nepal and Pakistan.
Question 23.
Explain with examples of the occupational structure of India’s population. (Delhi 2011)
Answer:
On the basis of economic status, India’s population is divided into three categories:
Main Workers Mam worker is a person who works for at least 183 days in a year.
Marginal Workers Marginal worker is a person who works for less than 183 days in a year.
Non-Workers It is a person who does not work for its livelihood.
About 54.6% of the total working population are cultivators and agricultural labourers, whereas only 3.8% of workers are engaged in household industries and 41.6% are other workers including non-household industries, trade commerce, construction and repair and other services.
The working proportion is relatively high in Himachal Pradesh, Sikkim, Chhattisgarh, Andhra Pradesh, Karnataka, Arunachal Pradesh, Nagaland, Manipur and Meghalaya.
The work participation rate is higher in economically backward states because a large number of people are required subsistence level activity.
It is a major characteristic of the working population in India that a large number of the working population is engaged in agricultural activities. The proportion of female workers is also very low in India.
Map-Based Questions
Question 24.
On the given political outline map of India, locate and label the following with appropriate symbols.
(i) The state having the largest area. (All Indio 2015)
(ii) The state having the smallest area. (Delhi 2012)
Answer:
Question 25.
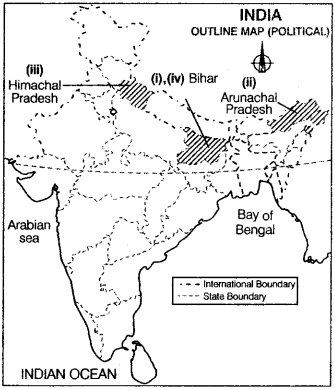
Locate and label the following on the given political outline map of India with appropriate symbols.
(i) The state having the highest density of population. (Delhi, All India 2011, All India 2008)
(ii) The state with the lowest density of population. (All Indio 2016)
OR
The state having the lowest density of population. (Delhi 2011)
(iii) The state with the highest percentage of the rural population. (All India 2010)
(in) The state having the lowest literacy rate in India. (Delhi 2008)
Answer:
Question 26.
Study the map given below carefully and answer the following questions. (All India 2009)

(i) Name the Union Territory having the highest density of population. State also its population density according to the given map.
(ii) Name any two states having the density of population from 801 to 1000 persons per sq km.
(iii) Name any two states which have population density from 401 to 600 persons per sq km.
Answer:
(i) Among the Union Territories, Delhi has the highest density of population of 11320 people per sq km.
(ii) Kerala and Uttar Pradesh have the density of population between 801 to 1000 persons per sq km.
(iii) Punjab and Haryana are two states having the density of population from 401 to 600 persons per sq km.
Question 27.
Study the map given below carefully and answer the following questions, (AH Indio 2008)
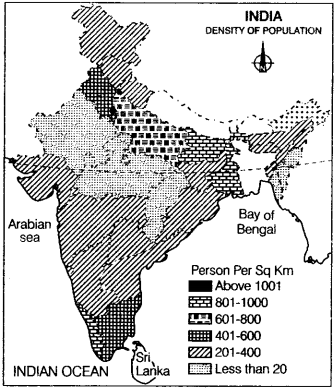
(i) Name the South Indian state, which has the highest density of population? Give one reason for its high density of population.
(ii) Name the two Eastern states having the highest density of population.
(iii) Name the three Northern states having a density of population less than 200 persons per sq km.
Answer:
(i) Among the Southern states, Kerala has the highest density between 801 and 1000 person per sq km. Coastal area and fertile soil have resulted in high population density in Kerala.
(ii) Among the Eastern states, Bihar and West Bengal have the highest density ranges from 801 to 1000 person per sq km. Fertile soils and development of industries are the major reasons for high density.
(iii) Among the Northern states, Jammu and Kashmir and Himachal – Pradesh have a lower density below 200 persons per sq km.
Data Based Question
Question 28.
Study the data given below carefully in the table and answer the following questions, (AH Indio 2008)
Decadal Growth Rate in India, 1901-2001
| Census Year | Total Population | Growth Rate | |
| Absolute Number | Percent of Growth | ||
| 1901 | 238396327 | ||
| 1911 | 252093390 | (+) 13697063 | (+J5.75 |
| 1921 | 251321213 | (-) 772117 | (-) 0.31 |
| 1931 | 278977238 | (+)27656025 | (+) 11.60 |
| 1941 | 318660580 | (+)39683342 | (+) 14.22 |
| 1951 | 361088090 | (+)42420485 | (+) 13.31 |
| 1961 | 439234771 | (+)77682873 | (+)21.51 |
| 1971 | 548159652 | (+)108924881 | (+) 24.80 |
| 1981 | 683329097 | (+)135169445 | (+) 24.66 |
| 1991 | 846302688 | (+) 162973591 | (+) 23.85 |
| 2001 | 1028610328 | (+)182307640 | (+) 21.54 |
(i) Which decade shows minus growth rate? What is the main reason for the decline in the population of this decade?
(ii) Which decades are referred to as the period of steady population growth? Give one reason for it.
(iii) Why has the population growth declined in the last two decades?
Answer:
(i) The decade of 1911-1921 shows the negative growth rate. The main reason for this negative growth rate was high mortality and a high birth rate.
(ii) 1921-1951 are referred to as the period of steady population growth. Growth rate increased because of improvement in sanitation and medical facilities. That’s why this phase is also known as a steady growth rate.
(iii) The growth rate during the last two decades has registered a decline because of the declining trend in birth rate. Literacy, awareness, implementation of family planning leads to the decline of birth rate.
Value Based Questions
Question 29.
“It is a detailed analysis of age and sex, place of residence, ethnic characteristics, tribes language, religion, marital status, literacy and education, occupational characteristics, etc in population geography”. Explain the values that can be derived from the passage.
Answer:
Following values can be derived from the passage:
- Gender Equality
- Community welfare
- Nationalism
Question 30.
“India is a land of linguistic diversity and population variation. The decade 1951-81 are referred to as the period of population explosion in India”. Explain the value that can help in changing the situation of population explosion
Answer:
Following values can change the situation:
- Social awareness
- Literacy development
- Creating awareness
- Family planning
We hope the Geography Class 12 Important Questions Chapter 11 Population: Distribution, Density, Growth and Composition help you. If you have any query regarding Geography Class 12 Important Questions Chapter 11 Population: Distribution, Density, Growth and Composition, drop a comment below and we will get back to you at the earliest.