CBSE Previous Year Question Papers Class 12 Economics Re-Exam 2018
Time allowed : 3 hours
Maximum marks: 80
General Instructions:
- All question in both sections are compulsory.
- Marks for questions are indicated against each questions.
- Question Nos. 1-4 and 13-16 are very short-answer questions carrying 1 marks each. They are required to be answered in one sentence each.
- Question Nos. 5-6 and 17-18 are short- answer questions carrying 3 marks each. Answer to them should normally not exceed 60 words each.
- Question No. 7-9 and 19-21 are also short-answer questions carrying 4 marks each. Answer to them should normally not exceed 70 words each.
- Question Nos. 10-12 and 22-24 are long- answer questions carrying 6 marks each. Answer to them should normally not exceed 100 words each.
- Answer should be brief and to the point and the above words limits should be adhered to as far as possible.
CBSE Previous Year Question Papers Class 12 Economics Re-Exam 2018
SECTION — A [30]
Question 1.
Which of the following measures of price elasticity shows elastic supply ? [1] (Choose the correct alternative)
(a) 0
(b) 0.5
(c) 1.0
(d) 1.5
Answer:
(d) 1.5
Question 2.
Define opportunity cost. [1]
Answer:
Opportunity cost is the cost of availing one opportunity in terms of the loss of the other opportunity.
Question 3.
At what level of production is total cost equal to the total fixed cost? [1]
Answer:
At zero level of production, the total cost is equal to total fixed cost.
Question 4.
Which of the following does not cause a shift of supply curve of a good? (Choose the correct alternative) [1]
(a) Price of input
(b) Price of the good
(c) Goods and services tax
(d) Subsidy
Answer:
(b) Price of the good.
Question 5.
A consumer buys 200 units of a good at a price of ₹ 20 per unit. Price elasticity of demand is (-) 2. At what price will he be willing to purchase 300 units? Calculate. [3]
Answer:
Original Price (P) = ₹ 20
Per Unit Original Quantity (θ) = 200 Units
Elasticity of’demand (Ed) = (-) 2
New Qty. (θ1) = 300 Units .
New Price (P1) = ?
Change in Qty. = New Qty. — Original Qty.
(Δθ) = 300 – 200 = 100 Units
New Price (P1) = ΔP – P
(Change in Price – Original Price)
Utilizing the formula:
Ed = \(\frac{\Delta \theta}{\Delta P} \times \frac{P}{Q}\)
Ed = Price elasticity of demand
Δθ = Change in Qty.
ΔP = Change in Price
P = Original Price
Q = Original Qty.
(-) sign is ignored since it tells only the inverse relationship between Price and Qty. demanded.
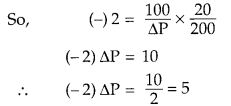
New Price (P1) = P – ΔP
= ₹20 – ₹5 = ₹ 15
Hence, New Price (P1) will be ₹ 15 at New Qty. of 300 units.
Question 6.
Explain the central problem of “What is to be produced and in what quantities”. [3]
OR
In what circumstances may the production possibility frontier shift away from the origin? Explain.
Answer:
It is the problem of choosing which goods and services should be produced and in what quantities. The economy cannot have more of everything with available resources at the same time. Thus, society has to decide between consumer goods and producer goods etc. Since resources are limited, all goods and services desired cannot be produced at the same time. So, the society has to decide which goods are to be produced and also the quantities in which they should be produced. Hence, the problem is related with two aspects i.e.,
(i) Which commodity should be produced ? (ii) In how much quantity ?
OR
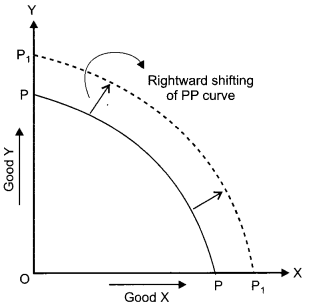
Shifting away of PPC from the origin means the rightward shift of production possibility frontier. It takes place because of the two main reasons:
(i) When resources of an economy increase: It may be in the form of discovery of new natural resources, availability of new machinery through saving and investment and increase in skilled and unskilled labour through population growth.
(ii) When there is an improvement in technology: It happens as a result of the work of scientists, engineers and inventors over a long period of time. In this case, more of the two goods can be produced with the given amount of resources, causing shift of PPC to the right. Rightward shifting can be shown through the following figure:
Question 7.
Explain the implications of “Freedom of entry and exit of firms” under perfect competition. [4]
Answer:
A firm can enter or leave the industry any time. The free entry and exit of the firm is possible only in the long period, not in the short period. Because of free entry and exit, firms in the long run earn only normal profits. (TR = TC or AR = AC). In case super normal profits are earned, new firms will get attracted and join the industry. Market supply will increase and extra profit will wipe out. In case of super normal losses, some of the existing firms will leave the industry. Market supply will decrease and hence, price will increase so extra losses will wipe out. In this way, firms can only earn normal profit in the long run.
Question 8.
Write a budget line equation of a consumer if the two goods purchased by the consumer, Good X and Good Y are priced at ₹ 10 and ₹ 5 respectively and the consumer’s income is ₹ 100. [4]
OR
Define marginal rate of substitution. Explain its behaviour along an indifference curve.
Answer:
Lets take the Price of Good X = P1
Price of Good Y = P2
Consumer’s income = Y’
According to the sum,
P1 = ₹ 10,
P2 = ₹ 5
Y1 = ₹ 100
Hence, budget equation is
P1X + P2Y = Y’
10X + 5Y = 100
OR
Marginal Rate of Substitution is the rate at which the consumer is ready to sacrifice some amount of good 1 for obtaining one more unit of another good 2 without affecting his total utility.
For example, a consumer has a bundle of two goods, say, 2x + 10y and shifts to another bundle of 3x + 6y maintaining the same level of satisfaction (total utility). Here, MRS is 4 (10 – 6) units of y which the consumer is willing to giving up to obtain an extra unit of x = (3x – 2x). It can also be illustrated with the help of the given figure.
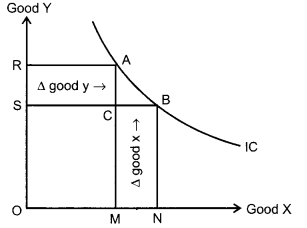
The two points A & B are taken on IC curve. At point A, a consumer gets a combination of OR (= MA) of good y and OM (= RA) of good X. Suppose he shifts from point A to point B where he gets combination of OS (= MC) of good y and ON (= SB) of good X. By this change, he loses AC (MA – MC) amount of good y and gains CB (ON – OM) amount of good X which means he is willing to substitute good X for good Y.
The slope of MRS can be understood as:

Question 9.
Explain the conditions of producer’s equilibrium under perfect competition.
Answer:
A producer is said to be in equilibrium at that level of output which gives him the maximum profit and he has no incentive to increase or decrease further. A producer attains equilibrium when following two conditions are fulfilled simultaneously.
(i) MC = MR (It is expressed as P = MC under perfect competition)
(ii) MC is greater than MR after MC = MR output level or MC curve cuts MR curve from below.
It can be explained with the help of a schedule and its graph.
| Units sold | MR (₹) | MC (₹) |
| 1 | 10 | 12 |
| 2 | 10 | 10 |
| 3 | 10 | 8 |
| 4 | 10 | 10 |
| 5 | 10 | 12 |
In the above schedule, Price (P) is constant and P = AR = MR. In the above schedule, condition 1 is satisfied initially at 2 level of units but the second condition is not satisfied thereafter since MC is below than MR at the next level so, producer is not in equilibrium.
Again at unit 4 MR = MC and MC is greater than MR thereafter so, producer will be in equilibrium at unit 4.
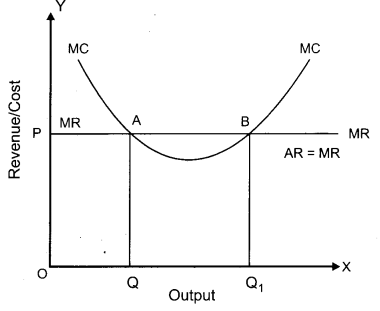
The situation is also shown in the graph. Under perfect competition, Price line is parallel to X-axis because it is constant and therefore, P = AR = MR. MC curve is as usual U-shaped which intersects MR (Price) curve at two points A and B. It means MR = MC at two places. But point B is only satisfying both the conditions essential for equilibrium, hence producer will be in equilibrium at point B.
Question 10.
Draw Average Variable Cost (AVC), Average Total Cost (ATC) and Marginal Cost (MC) curves in a single diagram. State the relation between MC curve and AVC & ATC curves.
[6]
Answer:
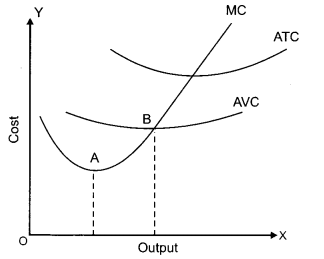
Relation between MC and AVC—
(i) When AVC falls, MC < AVC or AVC falls only when MC < AVC. (Diagrammatically MC curve lies below AVC curve till their intersection).
(ii) When AVC is minimum, MC = AVC or AVC is constant or minimum when MC AVC (Diagrammatically the point where MC curve intersects AVC curve is the minimum point of AVC).
(iii) When AVC rises, MC is more than AVC or AVC rises when MC > AVC. (Diagrammatically MC lies above AVC curve after intersecting AVC at its minimum point).
Relation between MC and ATC
(i) When AC (i.e., ATC) falls, MC< AC
(ii) When AC is constant, MC = AC
(iii) When AC rises, MC > AC
Question 11.
Define price floor. Explain the implications of price floor. [6]
OR
Market of a good is in equilibrium. Demand for the good ‘decreases’. Explain the chain of effects of this change.
Answer:
When Government fixes price of a product at a level higher than the equilibrium price, it is called support price (or floor price). It is the minimum price at which the producer must be paid for their products. Support price is generally fixed for agricultural products like food grains, sugar etc; to safeguard the interest of producers (farmers). For instance, Food Corporation of India (FCI) purchases wheat from the farmers at its fixed price and stores it in godown as buffer stock. The aim of support price is to insulate farmers from the fluctuations in their incomes caused by the price variations in the free market.
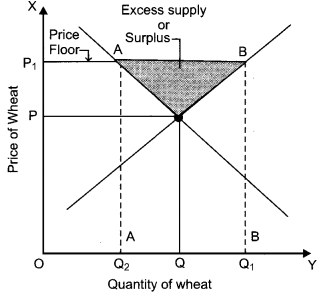
This figure shows OP as the equilibrium price and OQ as equilibrium quantity of wheat. The government fixes price at OP1, slightly above equilibrium price OP. Traders in the market are now bound to pay at OP1, but, a rise in price causes market demand to contract from OQ to OQ2, on the other hand market supply expands from OQ2 to OQ1– There emerges excess supply AB = Q1Q2 (OQ2 – OQ1). The government buys this surplus and stores it as a buffer stock.
The following are the implications of price floor:
- Assurance to the Farmers- The imposition of the price floor assures the farmers that whatever they produce will get sold in the market. This implies that the farmers can produce to their maximum.
- Assurance of Retums- Due to the price floor, the farmers need not to bother about the sale of their output. This ensures a minimum garuanteed return to their investment in the production process.
- Higher Income- The minimum guaranteed returns in form of minimum price and minimum wage to labourers result in increase in the income of the poor people.
- Burden on Consumers- Price floor exerts additional pressure on the consumers and the traders, as they need to buy the products at comparatively higher price instead of the equilibrium price.
- Burden on Govemment- It also puts extra burden ont the government revenues. It becomes mandatory for the government to purchase the excess produce, even if it runs a sufficient volume of buffer stocks.
- Higher Taxes- The government tries to shift the burden (associated with purchasing the excess produce at higher price) to the consumers and the traders in form of higher taxes.
OR
Market of a good is in equilibrium. If the demand for the good decreases, it will have the effects as shown through the following figure:
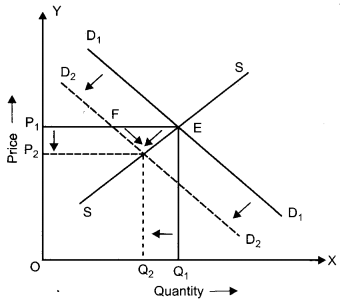
- D1D1 is the initial demand curve and SS is the supply curve.
- Both curves are cutting at point E which is the equilibrium point.
- At point E OP1 is the equilibrium price and OQ1 is the equilibrium quantity.
- As the demand decreases, D1D1 shifts to D2D2 in left.
- At the existing Price OP1 demand falls from E to F.
- As an immediate impact, there is excess supply in the market. It is EF (at the existing price.)
- Due to excess supply, price falls from OP1 to OP2. Due to the fall in price, the quantity supplied tends to contract. The contraction of supply occurs from E to F.
- The above process continues till excess supply is fully eliminated, and the market clears itself once again.
- The net effect of decrease in demand is
- decrease in equilibrium price from OP1 to OP2 and
- decrease in equilibrium quantity from OQ1 to OQ2.
Question 12.
A consumer consumes only two goods X and Y. Explain the conditions of consumer’s equilibrium using Utility Analysis. [6]
Answer:
When the consumer is consuming two commodities (say X and Y) he can reach the equilibrium when ratio of MU of a commodity to its price \(\left(\frac{\mathrm{MUx}}{\mathrm{P}_{\mathrm{x}}}\right)\) becomes equal to the ratio of MU of the other commodity to its price \(\left(\frac{\mathrm{MU} \mathrm{y}}{\mathrm{P}_{\mathrm{y}}}\right)\). Symbolically, it can be expressed as-
\(\frac{\mathrm{MUx}}{\mathrm{P}_{\mathrm{x}}}=\frac{\mathrm{MUy}}{\mathrm{P}_{\mathrm{y}}}\)
This equation also implies that if the price of the commodity x is equal to the price of the commodity y (Px = Py) the consumer will attain equilibrium when MUx = MUy.
It also means that satisf action is maximum when a rupee worth of MU is same in both the goods X and Y. Suppose a consumer has ₹ 20 with him to spend on two goods X and Y. Further suppose price of each unit of X is ₹ 5 and that of Y is ₹ 2. Now consumer may attain his equilibrium by utility approach in the following way:
| Utility schedule in case of two goods: | ||||
| Unit of goods | MUx (Utils) | Mux/Px (A rupee) worth of MU) | MUy (Utils) | MUy/Py (worth of MU) |
| 1 | 50 | 50 ÷ 5 = 10 | 24 | 24 ÷ 2 = 12 |
| 2 | 40 | 40 ÷ 5 = 8 | 22 | 22 ÷ 2 = 11 |
| 3 | 30 | 30 ÷ 5 = 6 | 20 | 20 ÷ 2 = 10 |
| 4 | 20 | 20 ÷ 5 = 4 | 18 | 18 ÷ 2 = 9 |
| 5 | 10 | 10 ÷ 5 = 2 | 16 | 16 ÷ 2 = 8 |
| 6 | 0 | – | 14 | 14 ÷ 2 = 7 |
For obtaining maximum satisfaction from spending his given income of ₹ 20, the consumer will buy 2’units of X, by spending ₹ 10 and 5 units of Y by spending ₹ 10. This combination of goods brings him maximum satisfaction because a rupee worth of MU in case of good X is 8 \(\left(\frac{\mathrm{MU}}{\mathrm{P}_{\mathrm{x}}}=\frac{40}{5}\right)\) and in case of good Y is also 8 \(\left(\frac{\mathrm{MU}}{\mathrm{P}_{\mathrm{x}}}=\frac{16}{2}\right) \text { i.e. } \frac{\mathrm{MUx}}{\mathrm{P}_{\mathrm{x}}}=\frac{\mathrm{MUy}}{\mathrm{P}_{\mathrm{y}}}\) since per rupee
MU is same, there is no incentive for consumer to buy more of one good and less of the other good.
SECTION—B
Question 13.
Define aggregate supply. [1]
Answer:
Aggregate supply is the total production of goods and services in the economy during the year.
Question 14.
State the two components of M1 measure of Money Supply. [1]
Answer:
The two components of M1, measure of Money Supply are currency and demand deposits.
Question 15.
Credit creation by commercial banks is determined by (Choose the correct alternative) [1]
(a) Cash Reserve Ratio (CRR)
(b) Statutory Liquidity Ratio (SLR)
(c) Initial Deposits
(d) All the above
Answer:
(d) All the above
Question 16.
Give one example of negative externalities. [1]
Answer:
If you produce chemicals and cause pollution as a side effect, then local fishermen will not be able to catch fish. This loss of income will be the negative externality.
Question 17.
Define investment multiplier. How is it related to marginal propensity to consume ? [3]
Answer:
The number of times by which income increases as a result of increase in investment is called investment multiplier. Investment multiplier shows a relationship between initial increment in investment and the resulting increment in national income.
K = \(\frac{\Delta Y}{\Delta I}\)
where K = multiplier
ΔY = change in income
ΔI = change in investment
Relation of multiplier with MPC :
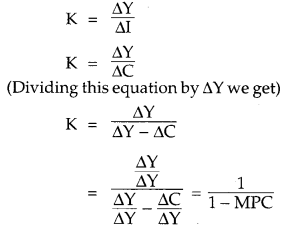
There is a direct relation between K and MPC. If MPC is high, K will also be high but if MPC is low K will also be low.
Question 18.
Distinguish between stock and flow variables with suitable examples. [3]
OR
What are capital goods ? How are they different from consumption goods ?
Answer:
Difference between stock and flow variables is:
| Stock | Flow |
| (i) Stock relates to a point of time, e.g. your saving as on January 1, 2014 are ₹ 10,000. | Flow relates to the period of time, e.g. your pocket expenses of ₹ 20 per day. |
| (ii) Stock is not timedimensional. | Flow is time-dimensional as per hour, per month, per year. |
| (iii) Stock influences the flow, greater the stock of capital, greater is the flow of goods and services. | Flow influences the stock. For example, monthly increase in the supply of money leads to an increase in the quantity of money. |
| (iv) Example – Population of a country, Bank deposit etc. | Expenditure of money, interest on capital etc. |
Difference between capital goods and consumption goods is:
| Consumption Goods | Capital Goods |
| (i) Goods which are consumed for their own sake to satisfy current needs of the consumers directly are consumption goods.
|
Capital goods are fixed assets of producers which are repeatedly used in production of other goods and services. |
| (ii) These are used for achieving satisfaction. | These are used for generating income by production units. |
| (iii) Consumption goods meet the basic objective of an economy i.e. to sustain the consumption of entire population of the economy. | Capital goods are producer’s goods which are repeatedly used in production process for generating income. |
| (iv) For example – Food, shoes, retailers, barbers etc. | For example – Machine, tools, technology etc. |
Question 19.
What is ex-Ante consumption ? Distinguish between autonomous consumption and induced consumption. [3]
Answer:
Ex-Ante consumption refers to planned or desired consumption expenditure of households. Consumption function is represented by:
C = \(\overline{\mathrm{C}}\) +bY
Where,
C = Consumption expenditure
\(\overline{\mathrm{C}}\) = Autonomous consumption
b = Marginal propensity to consume (MPC)
Y = National Income
Difference between Autonomous and Induced consumption:
| Autonomous Consumption | Induced Consumption |
| (i) When consumption occurs even at zero level of income, this is called as Autonomous consumption. | When consumption increases by increase in income, it is known as induced consumption. |
| (ii) It is generally done in government sector. | It is generally done in private sector. |
| (iii) It is income inelastic, i.e., it is not affected by change in income level. | It is income elastic, i.e., it is affected by change in income level.
|
Question 20.
What is monetary policy? State any three instruments of monetary policy. [4]
Answer:
Monetary Policy is the policy of the central bank of a country to regulate and control money supply and credit in the economy.
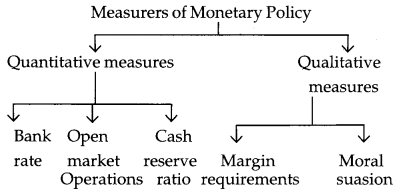
Bank rate: Bank rate is the rate of interest charged by the central bank on loans given to the commercial banks. In a situation of excess demand leading to inflation, central bank raises bank rate. This raises cost of borrowing which discourages commercial banks to borrow from the central bank. Raising bank rate forces the commercial banks to raise their lending rate of interest to consumers and investors. Thus, makes credit costlier. As a result, demand for loans falls or vice-versa.
Open Market Operations: It refers to the sale and purchase of government securities and bonds in the open market by the central bank. Sale of securities by central bank brings flow of money to central bank from commercial banks thereby restricting their lending capacity. During inflation, central bank sells Government securities to commercial banks which lose equivalent amount of cash reserve thereby affecting their capacity to offer loans. This absorbs liquidity from the system. As a result, there is a fall in investment and aggregate demand. Thus, it is an effective measure to control credit.
Cash Reserve Ratio (CRR): It is the ratio of bank deposits that a commercial bank must keep as reserve in cash with the central bank. It is compulsory for each commercial bank. When there is an inflationary situation, central bank raises the rate of CRR thereby making the banks to keep more cash reserve with RBI which curtails the lending capacity of commercial banks. Opposite takes place at the time of recursion. In this way, the central bank keeps control on the flow of money in an economy.
Question 21.
Define full employment in an economy. Discuss the situation when aggregate demand is more than aggregate supply at full employment income level. [4]
OR
What are two alternative ways of determining equilibrium level of income? How are these related ?
Answer:
Full employment refers to a situation in which every able bodied person who is willing to work at the prevailing rate of wages is, in fact, employed.
Excess demand or Inflationary gap: When in an economy, aggregate demand is in excess of aggregate supply at full employment, the situation is termed as excess demand and the gap created is called inflationary gap.
For example: Lets suppose an imaginary economy, where by employing all of its available resources, it can produce 10,000 qtls of rice. If aggregate demand for rice is, say 12,000 qtls, this demand will be called as excess demand and the gap between demand & supply is called inflationary gap.
The situation is shown through a graph:
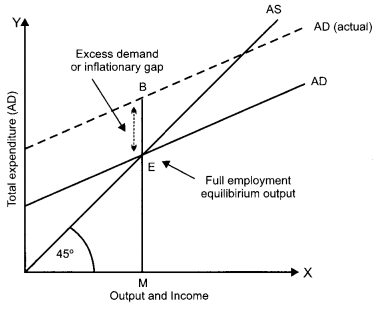
In the graph, Point E lying on the 45° line is the full equilibrium point. This is an ideal situation because aggregate demand represented by EM is equal to full employment level of output represented by OM. The actual aggregate demand is for a level of output BM which is greater than full employment level of output EM (OM). Thus, the difference between the two is EB = (BM – EM) which is measure of inflationary gap.
OR
Equilibrium level of income is that level of income at which aggregate demand equals aggregate supply, (and planned savings equals planned investment)
The two different alternatives to reach at the equilibrium level of income are:
(i) Increase in Govt. Expenditure to pump more money in the system to increase demand. During the period of deficiency of demand, the Government should make large investments in public works like-construction of roads, bridges, buildings, railways, canals and provide free education and medical facilities although it may enlarge budget deficit. The aim is to give more money in the hands of people so that they should spend more.
(ii) Central bank should buy Govt, bonds and securities from commercial banks to increase cash stocks of banks for lending. By doing this money flow will increase in the economy. People will take loans from the banks to install new projects. More people will get jobs thus, income will increase, in turn, consumption will also increase and economy will move towards achieving equilibrium level of income.
Question 22.
Discuss briefly the meanings of: [6]
(i) Fixed Exchange Rate
(ii) Flexible Exchange Rate
(iii) Managed Floating Exchange Rate
Answer:
(i) Fixed Exchange Rate : Fixed exchange rate is the rate which is officially fixed by the government or monetary authority on a daily or monthly basis. In this system, foreign central banks stand ready to buy and sell their currencies at a fixed price. A typical kind of system was used under gold standard system in which each country committed itself to convert freely its currency into gold at a fixed price.
(ii) Flexible Exchange Rate: It is the rate which is determined by market force of supply and demand in the foreign exchange market. There is no official intervention. Here, the value of a currency is left completely free to be determined by market force of demand and supply of the currencies concerned. Under this system, the central banks, without intervention, allow the exchange rate to adjust so as to equate the supply and demand for foreign currency.
(iii) Managed Floating Exchange Rate: It is also called Dirty floating exchange rate. It is a system of floating exchange rate (where exchange rate is determined by the forces of demand and supply) but the one which the central bank of the country tries to manage by way of planned sale and purchase of foreign currencies in the international money market.
Question 23.
What is government budget? Explain its major components. [6]
OR
Explain (a) allocation of resources and (b) economic stability as ob j ectives of government budget.
Answer:
“A government budget is an annual financial statement showing estimated receipts and estimated expenditure of the government during a fiscal year.”
Components of the budget: The budget is divided into two main parts:
(i) Revenue Budget (ii) Capital Budget
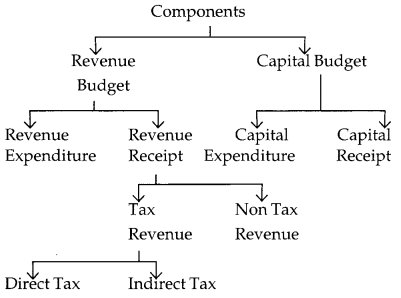
(i) Revenue Budget : It comprises of current revenue receipts and current revenue expenditures met from such revenues. It includes the following components:
(a) Revenue Receipt : It includes tax revenue and non-tax revenue.
Tax Revenue: Tax revenue consist of proceeds of taxes and other duties levied by the union government. It may be direct or indirect taxes.
(i) Direct tax: When liability to pay a tax and the burden of that tax falls on the same person. The tax is called a direct tax. For e.g. income tax, corporate tax etc.
(ii) Indirect Tax: When liability to pay a tax is on one person and the burden of that tax falls on some other person, the tax is called an indirect tax. For e.g. custom duty, excise duty etc.
Non-tax Revenue : Income from sources other than taxes is called non-tax revenue. For e.g. interest, fees and fine, grant in aid etc.
(b) Revenue Expenditure: An expenditure which neither creates assets nor reduces liability is called revenue expenditure. For e.g. salaries of employees, interest, payment on past debt, subsidies etc.
(ii) Capital Budget: It comprises of current capital receipts and current capital expenditures which are described as :
(a) Capital Receipt: Government receipts which either create liabilities or reduces assets are called capital receipts. For example- borrowings, raising of funds from PPF and small saving deposits.
(b) Capital Expenditure: An expenditure which either creates an asset or reduces a liability is called capital expenditure. This type of expenditure adds to the capital stock of the economy and raises its capacity to produce more in future.
OR
(a) Allocation of Resources: To allocate resources in line with social and economic objectives, Government provides more resources into socially productive sectors where private sector is not involved eg. sanitation, water supply, rural development, education, health etc. More¬over Government allocates more funds for the production of socially useful goods and draws away resources from some other sectors to promote balanced economic growth of different regions. Moreover Govenment also undertakes production directly when necessary.
(b) Economic Stability: Government can bring economic stability i.e. can control fluctuations in general price level through taxes, subsidies and expenditure. For instance, when there is inflation, govt, can reduce its own expenditure and when there is depression characterized by falling output and prices, government can reduce taxes and grant subsidies to encourage spending by people.
Question 24.
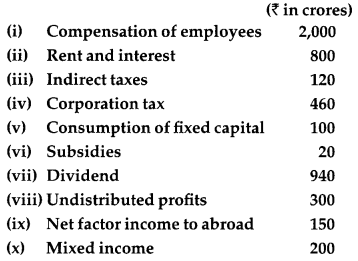
Calculate (a) Operating Surplus, and (b) Domestic Income: [6]
Answer:
(a) Operating Surplus :
OS = Corporation tax + Rent and Interest + Dividend + Undistributed profits.
OS = (iv) + (ii) + (vii) + (viii)
= 460 + 800 + 940 + 300
= ₹ 2,500 crores
(b) Domestic Income:
NDPFc = Compensation of employees + Operating surplus + Mixed income
= 2000 + 2500 + 200 = 4,700 crore
Answer: OS = 2,500 crore
DI = 4,700 crore