CBSE Previous Year Question Papers Class 12 Economics 2017 Delhi
Time allowed : 3 hours
Maximum marks: 100
** Answer is not given due to change in the present syllabus
CBSE Previous Year Question Papers Class 12 Economics 2017 Delhi Set – I
Section — A
Question 1.
The demand of commodity when measured through the expenditure approach is inelastic. A fall in its price will result in : (Choose the correct alternative) [1]
(a) no change in expenditure on it.
(b) increase in expenditure on it.
(c) decrease in expenditure on it.
(d) any one of the above.
Answer:
(c) decrease in expenditure on it.
Question 2.
As we move along a downward sloping straight line demand curve from left to right, price elasticity of demand: (Choose the correct alternative) [1]
(a) remain unchanged
(b) goes on falling
(c) goes on rising
(d) falls initially then rises
Answer:
(b) goes on falling.
Question 3.
Define market demand. [1]
Answer:
Market demand refers to the sum total of individual demands at a given price during a period of time.
Question 4.
Average revenue and price are always equal under: (choose the correct alternative) [1]
(a) perfect competition only
(b) monopolistic competition only
(c) monopoly only
(d) all market forms
Answer:
(d) all market forms.
Question 5.
State any one feature of oligopoly. [1]
Answer:
Oligopoly has few firms that makes the large majority of market share.
Question 6.
Distinguish between micro-economics and macro-economics. [3]
Answer:
| Micro-economics | Macro-economics |
| (a) Studies about individual economic units likq households, firms, consumers, etc. | It studies about an economy as a whole. |
| (b) It deals with how consumers can make their decisions depending on their given budget and other variables. | It deals with how different economic sectors can make their decisions. |
| (c) It uses the method of partial equilibrium, i.e., equilibrium in one market. | It uses the method of general equilibrium, i.e., equilibrium in all markets of an economy as a whole. |
Question 7.
State the meaning and properties of production possibilities frontier. [3]
Answer:
Production possibilities frontier refers to the frontier which shows the production combination of commodities by available resources and techniques.
Properties of production posibilities frontier :
- Concave to the origin: PPF is convave to the origin as to increase one additional unit of output, more and more units of another good is sacrificed.
- Downward sloping from left to right: PPF is downward sloping from left to right because more and more units of good are sacrificed to gain one additional unit of another good.
Question 8.
Show that demand of a commodity is inversely related to its price. Explain with the help of utility analysis. [3]
OR
Why is an indifference curve negatively sloped? Explain.
Answer:
Demand refers to the quantity which a consumer is willing to purchase through the given income of the consumer during a specific period of time.The demand of a commodity is inversely related to its price. If the price of a commodity increases, then the demand of it decreases. On the contrary, if the price of a commodity decreases then the demand of it increases.
This happens because of law of marginal utility. As more and more units of a good are consumed, MU derived from that commodity tends to diminish. As a result, demand of a commodity is inversely related to its price.
OR
Indifference curve refers to the curve showing consumption combinations of two commodities which yield the same level of satisfaction to the consumer.
An indifference curve is negatively sloped because:
If the quantity of one good is decreased then the quantity of other good will increase. It means that with the additional consumption of one commodity, a consumer has to sacrifice less and less units of other commodity. This slope of indifference curve is also called Marginal Rate of Substitution of Good X and Good Y, denoted as
MRS xy = \(\frac{\Delta X}{\Delta Y}\)
Question 9.
Explain the conditions of consumer’s equilibrium under indifference curve approach. [4]
Answer:
Intensity of desire of a commodity, tends to decrease as more and more units of a commodity are consumed. In other words, successive units of consumption offer less satisfaction. It is considered as the law of diminishing marginal rate of substitution.
In other words, it is a ratio of number of units of goods sacrificed to produce one additional unit of other goods by substituting the resources.
For ex:
| Good 1 | Good 2 | MRS |
| 1 | 10 | – |
| 2 | 7 | 3 |
| 3 | 5 | 2 |
| 4 | 4 | 1 |
Question 10.
State different phases of the law of variable proportions on the basis of total product. Use diagram. [4]
OR
Explain the geometric method of measuring price elasticity of supply. Use diagram.
Answer:
Law of Variable Proportion is enforced during short-run. It states that as more variable factors are used with the fixed factors the marginal product of that factor will decrease. So, a stage will ultimately come when MP of variable factors starts declining.
| Units of Labour | TP (Units) | MP (Units) |
| 1 | 2 | 2 |
| 2 | 5 | 3 |
| 3 | 9 | 4 |
| 4 | 12 | 3 |
| 5 | 14 | 2 |
| 6 | 15 | 1 |
| 7 | 15 | 0 |
| 8 | 14 | -1 |
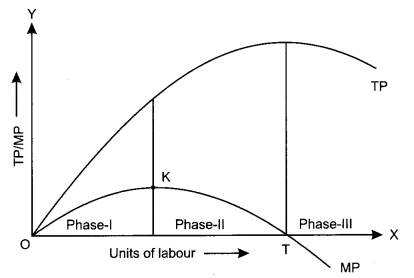
According to the schedule and figure from origin to point K, TP is increaing at increasing rate and MP is also increasing.
From point K to T, MP is diminishing while TP is increasing at diministing rate.
At point T, MP is zero and TP is optimum. Beyond point T, TP starts falling while MP becomes negative.
OR
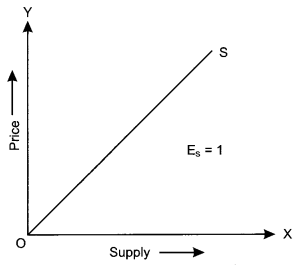
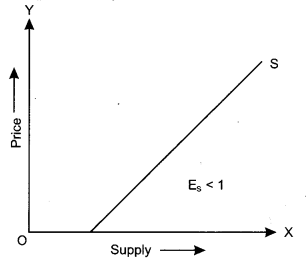
Price elasticity of supply refers to the proportionate relationship between the percentage change in quantity supplied and percentage change in price.
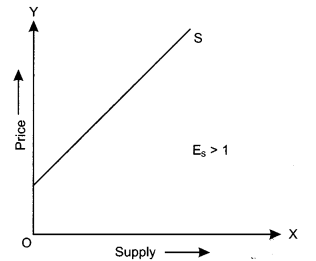
According to Geometric Method, elasticity of supply depends on the origin of supply curve. Therefore, elasticity of supply should have three situations:
(a) Es = l
(b) Es > 1
(c) Es < 1
(a) Es = 1 ⇒ When a straight line positively sloped supply curve starts from the point of origin.
(b) Es > 1 ⇒ When a straight line positively sloped supply curve starts from Y-axis.
(c) Es < 1 ⇒ When a straight line positively sloped supply curve starts from X-axis.
Question 11.
Explain the ‘free entry and exit of firms’ feature of monopolistic competition. [4]
Answer:
Monopolistic competition is a form of market in which large number of sellers sell different kinds of products. There is a difference in their trade mark, brand name, packaging, etc. The commodities produced by each firm are close substitutes of one another.
The new firms can enter into a market and the existing firms can leave the market as per their own willingness but sometimes, they face a monopolist restriction i.e., Cartel. There are neither abnormal profits nor any abnormal losses to a firm in the long run. This feature is important as all the firms are able to earn enough profit to continue their production. But entry in monopolistic competition is not so easy and free like perfect competition.
Question 12.
When price of a commodity X falls by 10 percent, its demand rises from 150 units to 180 units. Calculate its price elasticity of demand. How much should be the percentage fall in its price so that its demand rises from 150 to 210 units? [6]
Answer:
Percentage change in Price = (-) 10%
Q = 150 units
Q1 = 180 units.
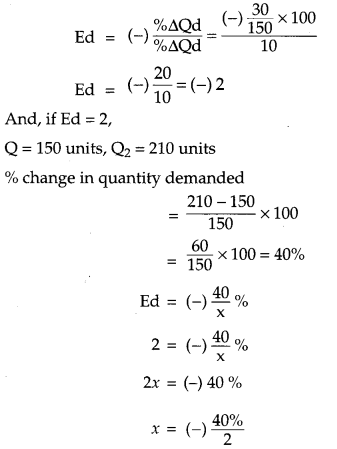
Ed = x = – 20 %
Therefore, percentage fall in price will be 20%.
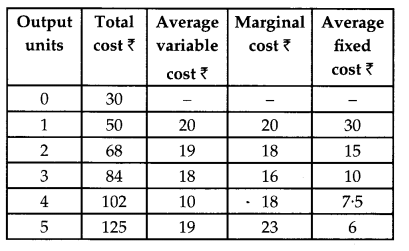
Question 13.
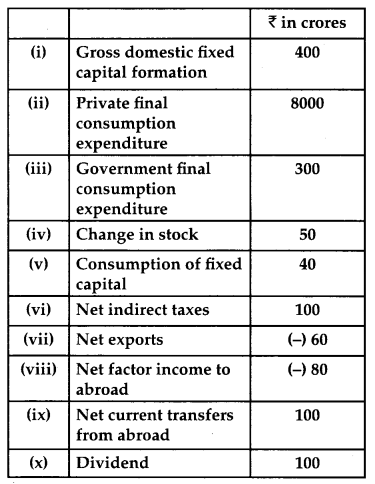
Complete the following table : [6]
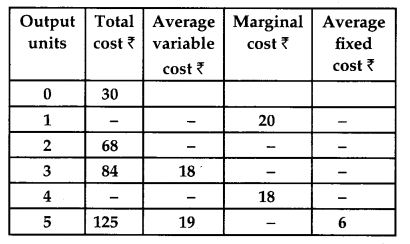
Answer:
Question 14.
Good Y is a substitute of good X. The price of Y falls. Explain the chain of effects of this change in the market of X. [6]
OR
Explain the chain of effects of excess supply of a good on its equilibrium price.
Answer:
Substitute goods refer to goods which can be consumed instead of each other. For example. For example, tea and coffee are substitute goods. If X and Y are susbtitute goods, then a fall in the price of good Y will lead to a fall in the demand of good X. This is because with a fall in the price of good Y, it will become cheaper in comparison to good X, and the demand for good Y will increase and that of good X will fall.
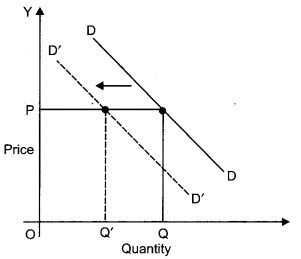
According to the diagram, DD is the initial demand curve for good X. At price OP, OQ quanitity of good X is demanded. With a fall in the price of good Y, the demand for good X falls. Accordingly, the demand curve for good X shifts parallelly leftwards to D’D’. Here, even at the existing price OP, the quantity demand for good X falls to OQ’.
Consider DD to be the initial demand curve and SS to be the supply curve of the market. Market equillibrium is achieved at Point E, where the demand and supply cruves intersect each other. Therefore, the equilibrium price is OP, and the equilibrium quantity demanded is OQ1. When there is change in other factors than price, there will be rise in the supply of goods. There will be a shift in the supply curve towards the right to S1S1 with an increase in the supply, and the demand curve DD will remain the same. This implies that there will be a situation of excess supply.
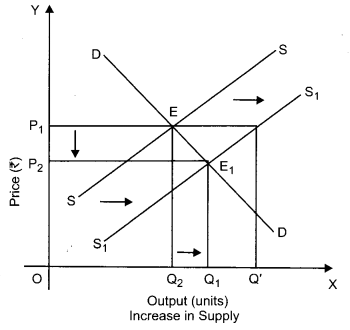
In the above diagram, there is an excess supply of OQ1 to OQ`.
Units of output are high at the initial price OP1. There by, the producers will tend to reduce the price of the output to increase the sale in the market. Profit margin of the firm will come down and slowly some of the firms will tend to quit the market. Because of this, the market supply will decline to OQ2 level of output and the price of the output also gets reduce to the point OP2. Now, the new market equilibrium will be at Point E1, where the new supply curve S1S1 intersects the demand curve DD.
Question 15.
Given below is the cost schedule of a product produced by a firm. The market price per unit of the product at all levels of output is ₹ 12. Using marginal cost and marginal revenue approach, find out the level of equilibrium output. Give reasons for your answer: [6]
| Output (Units) | 1 | 2 | 3 | 4 | 5 | 6 |
| Average Cost (₹) | 12 | 11 | 10 | 10 | 10.4 | 11 |
Answer:
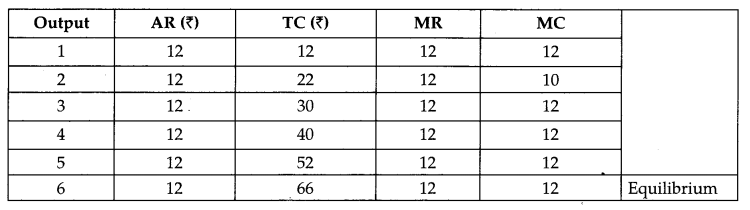
At 5th unit of output, the producer will be in equilibrium because at this unit, MR is equal to MC and MC curve cuts MR from below.
Section – B
Question 16.
The ratio of total deposits that a commercial bank has to keep with Reserve Bank of India is called (choose the correct alternative) [1]
(a) Stautory liquidity ratio
(b) Deposit ratio
(c) Cash reserve ratio
(d) Legal reserve ratio
Answer:
(c) Cash reserve ratio.
Question 17.
Aggregate demand can be increased by : (choose the correct alternative) [1]
(a) Increasing bank rate
(b) Selling government securities by Reserve Bank of India
(c) Increasing cash reserve ratio
(d) None of the above
Answer:
(d) None of the above.
Question 18.
Give the meaning of involuntary unemployment. [1]
Answer:
Involuntary unemployment refers to the situation of unemployment when a person is willing to work but does not get any work.
Question 19.
What is primary deficit? [1]
Answer:
Primary deficit indicate the amount of borrowings required by the government to meet the expenditure other than interest payment.
Question 20.
Give the meaning of balance of payments. [1]
Answer:
Balance of Payments refers to the accounting statement that provides a systematic record of all the economic transactions between residents of a country and the rest of the world in a given period of time.
Question 21.
Distinguish between final goods and intermediate goods. Give an example of each. [3]
Answer:
Final Goods
(a) These are those goods which are either used for consumption or for investment purpose.
(b) They are included in both national and domestic income.
(c) For e.g., milk purchased by households. Intermediate Goods
(a) These goods are those goods which are used either for resale or for further production in the same year.
(b) They are neither included in national income nor in domestic income.
(c) For e.g. milk used in dairy for resale.
Question 22.
Explain the store of value function of money. ** [3]
OR
State the meaning and components of money supply.
Answer:
Money supply refers to the total value of money held by public at a particular point of time.
Components of Money Supply
(a) M1 = It is the first and basic measure of money supply.
M1 = Currency and coins with Public + Demand deposits of commercial banks + Other deposits.
(b) M2 = It is the broader concept.
M2 = M1 + Saving deposits with Post Office Savings Banks
(c) M3 = Broader concept
M3 = M1+ Net time deposits with banks.
(d) M4 = M3 + Total deposits with post office savings bank (Excluding NSC).
Question 23.
Explain the basis of classifying taxes into direct and indirect tax. Give examples. [3]
Answer:
The basis of classifying taxes into direct and indirect tax is whether the burden of the tax is shiftable to others or not. If it is not shiftable, i.e., when liability to pay taxes and the burden falls on the same person, it is a direct tax. And when the burden of a tax is shiftable i.e., liability to pay taxes falls on some person and burden on the other, known as indirect taxes.
Examples of direct taxes are Income tax, corporate tax whereas, sales tax and service tax are the examples of indirect tax.
Question 24.
Explain ‘banker to the government’ function of the central bank. [4]
OR
Explain the role of reverse repo rate in controlling money supply.
Answer:
The Reserve Bank of India acts as a Banker, agent and a financial advisor to the Central Government.
As a banker, it carries out all the banking business of the Government as :
(a) It maintains a current account for keeping their cash balances.
(b) It accepts receipts and makes payments for the Government and carries out exchange and other banking operations.
(c) It also gives loans and advances to the Government.
OR
Reverse Repo Rate is the rate at which RBI borrows money from commercial banks.
(a) RBI makes use of this tool when it feels that there is an excess money supply in the banking system.
(b) Banks are always happy to lend money to RBI as there money is in safe hands with a good interest.
Question 25.
Explain how government budget can be used to influence distribution of income ? [4]
Answer:
Government budget is an annual statement, showing estimation of receipts and expenditure during a fiscal year. Government budget would influence the distribution of income when, Government will spend less to control the level of income in the economy. On the contrary, it will spend more to decrease the level of income in the economy.
Question 26.
An economy is in equilibrium. From the following data about an economy, calculate autonomous consumption. [4]
(a) Income = 5000
(b) Marginal propensity to save = 0.2
(c) Investment expenditure = 800
Answer:
Given that, Income (y) = 5000
Marginal Propensity to save (s) = 0.2
Therefore, marginal propensity to consume
= 1 – MPS
= 1 – 0.2 = 0.8
∴ Y = C + by + I
⇒ 5000 = C + 0.8 × 5000 + 800
⇒ 5000 = C + 4000 + 800
⇒ 5000 = C + 4800
⇒ 5000 – 4800 = C
⇒ 200 = C
⇒ Autonomous Consumption = 200
Question 27.
Why does the demand for foreign currency fall and supply rises when its price rises ? Explain. [6]
Answer:
Demand for foreign currency, comes from the people who need it to make payment in foreign currency.
Supply of foreign currency comes from the
people who receive it due to following reasons :
(a) Exports of goods and services
(b) Foreign Investment ‘
(c) Speculations
Resons for rise in supply :
(i) When the price of a foreign currency rises, domestic goods become relatively cheaper. It induces the foreign country to increase their imports from the domestic country. As a result, supply of foreign currency rises. For e.g., if price of U.S dollar rises from ₹ 45 to ₹ 50, then exports to USA will increase as Indian goods will become cheaper. It will raise the supply of U.S. dollars.
(ii) When price of a foreign currency rises, supply of foreign currency rises as people want to make gains from speculative activities.
Question 28.
Explain ‘non-monetary exchanges’ as a limitation of using gross domestic product as an index of welfare of a country. [6]
OR
How will you treat the following while estimating domestic product of a country ? Give reasons for your answer:
(a) Profits earned by branches of country’s bank in other countries
(b) Gifts given by an employer to his employees on independence day
(c) Purchase of goods by foreign tourists
Answer:
Many activities in an economy are not evaluated in monetary terms, for e.g., Non¬market transactions like services of house wife, kitchen gardening, etc. are not included in GDP due to non-availability of data. It is difficult to ascertain their market value as they are not rendered for the purpose of earning income. Though these services are rendered for the development of a child and welfare of the family, it is not incl uded in the gross natinal product. Thus, non-monetary exchanges is a limitation of using gross domestic product as an index of welfare of a country.
OR
(a) Not included in domestic income as it is earned outside the domestic territory of the country.
(b) Not included as it is a transfer payment.
(c) Included as the expenditure is done within the domestic territory.
Question 29.
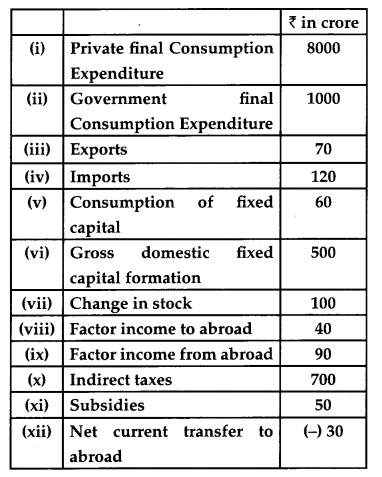
Calculate (a) net domestic product at factor cost and (b) gorss national disposable income : **
Answer:
(a) NDPFc = (i) + (ii) + (vi + vii) + (iii – iv) – (v) – (x) + (xi)
= 8000 + 1000 + (500 + 100) +
(70 -120) – 60 – 700 + 50
= 9000 + 600 + (-50) – 60 – 650
= 9600 – 50 – 710
= 9600 – 760
= 8840 Crores
Question 30.
Assuming that increase in invesment is ₹ 1000 crore and marginal propensity to consume is 0.9. Explain the working of multiplier. [6]
Answer:
Given that Value of MPC = 0.9
Initial increase in investment = ₹ 1000 crore
So, every increase of ₹ 1 in the income, 0.9 part of the increased income will be consumed by people.
Consumption = ₹ 0.90
Saving = ₹ 0.10
It is given that initial increase in investment of ₹ 1000 will lead to change in the income by ₹ 1000 in the first round. As MPC is 0.9 so people will consume 0.9 of the increased income i.e., ₹ 900 there by saving ₹ 100. In the next round due to increase in the consumption expenditure by ₹ 900 there will be an increase in income by ₹ 900. Then people will again spend the increased income i.e., ₹ 810 and save the rest part of the income ₹ 90. similarly, this process will continue and the income will go on increasing as a result of the increase in consumption. The total change in the income is ₹ 10,000 and the change in the investment will be ₹ 1,000.
CBSE Previous Year Question Papers Class 12 Economics 2017 Delhi Set – II
Note: Except for the following questions, all the remaining questions have been asked in previous sets.
Question 6.
Explain the problem of “What to produce’. [3]
Answer:
What to produce refers to the most important central problem. There are two
Answer:
What to produce refers to the most important central problem. There are two types of commodities which a consumer has to produce:
(1) War – Time commodities
(2) Peace – Time commodities
An economy has to decide from these two commodities.
Question 9.
A consumer consumes only two goods : Explain the conditions of consumer’s equilibrium using utility analysis. [4]
Answer:
A consumer gets equilibrium while consuming two commodities at the point where marginal utility of two commodities is equal to each other.
Let the two goods be X and Y. The equilibrium conditions are:
(1) \(\frac{\mathrm{MU}_{\mathrm{x}}}{\mathrm{P}_{\mathrm{x}}}=\frac{\mathrm{MU}_{\mathrm{y}}}{\mathrm{P}_{\mathrm{y}}}\)
(2) MU of a good falls as more of it is consumed.
Explanation of consumer’s equilibrium using utility analysis :
(1) Suppose \(\frac{\mathrm{MU}_{\mathrm{x}}}{\mathrm{P}_{\mathrm{X}}}>\frac{\mathrm{MU}_{\mathrm{y}}}{\mathrm{P}_{\mathrm{Y}}}\). It makes per rupee MUx mbre tharf per rupee MUy. This induces the consumer to buy more of X and less of Y. As a result MUX starts falling and MUy starts rising. The process continues till
\(\frac{\mathrm{MU}_{\mathrm{x}}}{\mathrm{P}_{\mathrm{x}}}>\frac{\mathrm{MU}_{\mathrm{y}}}{\mathrm{P}_{\mathrm{y}}}\) again
(2) Unless the MU of a good falls as more of it is consumed, the consumer will never reach equilibrium again, as \(\frac{\mathrm{MU}_{\mathrm{x}}}{\mathrm{P}_{\mathrm{x}}}\) equal to \(\frac{\mathrm{MU}_{\mathrm{y}}}{\mathrm{P}_{\mathrm{y}}}\)
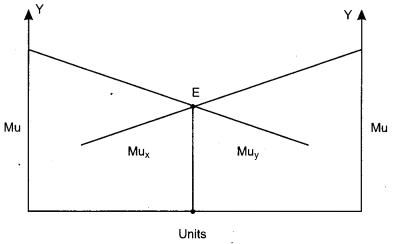
Thus, E is the Equilibrum point.
Question 14.
X and Y are complementary goods. The price of Y falls. Explain the chain of effects of this change in the market of X. [6]
OR
Explain the chain of effect of excess demand of a good on its equilibrium price.
Answer:
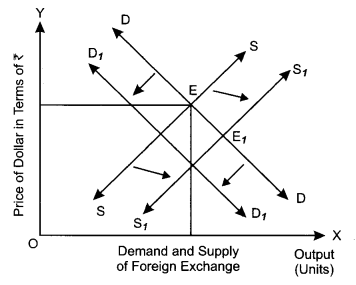
If X and Y are complementary goods, then a fall in the price of good Y will lead to a rise in the demand of good X. Graphically, the effect of this change can be seen as follows :
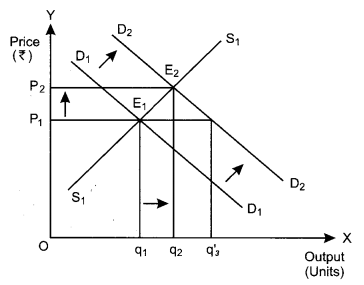
Here, suppose D1D1 and S1S1 are the initial market demand curve and market supply curve, respectively. The initial equilibrium is established at point E1, where the market demand curve and the market supply curve intersects each other. Accordingly, the equilibrium price is OP1 and the equilibrium quantity demanded is Oq1
Now, as the market demand of good X increases, this shifts the market demand curve parallely rightwards to D2D2 from while the market supply curve remains unchanged at S1S1. This implies that at the initial price OP1, there exist excess demand equivalent to (Oq’3-Oq1) units. This excess demand will increase competition among the buyers and they will now be ready to pay a higher price to acquire more units of good. This will further raise the market price. The rise in the price will continue till the market price becomes OP2. The new equilibrium is established at point E2, where the new demand curve D2D2 intersects the supply curve S1S1. Observe that, at the new equilibrium both market price and quantity demanded are more than the initial equilibrium. The new equilibrium quantity supplied Oq2 and the new equilibrium price is OP2. Hence, an increase in demand with supply remaining constant, results in rise in the equilibrium price as well as the equilibrium quantity.
OR
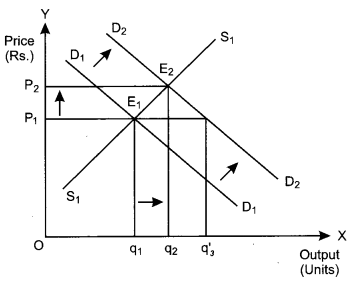
Suppose D1D1 and S1S1 are the initial market demand curve and market supply curve, respectively. The initial equilibrium is established at point Ei, where the market demand curve and the market supply curve intersects each other. Accordingly, the equilibrium price is OP1 and . the equilibrium quantity demanded is Oq1.
Now, assume that market demand increases (may be due to an increase in the consumer’s income). This shifts the market demand curve parallely rightwards to D2D2 from D1D1, while the market supply curve remains unchanged at S1S1– This implies that at the initial price OP1, there exist excess demand equivalent to (Oq’3 – Oq1) units. This excess demand will increase competition among the buyers and they will now be ready to pay a higher price to acquire more units of good. This will further raise the market price. The rise in the price will continue till the market price becomes OP2. The new equilibrium is established at point E2, where the new demand curve D2D2 intersects the supply curve S1S1. Observe that at the new equilibrium both market price and quantity demanded are more than the initial equilibrium. The new equilibrium quantity supplied Oq2 and the new equilibrium price is OP2. Hence, an increase in demand with supply remaining constant, results in rise in the equilibrium price as well as the equilibrium quantity.
To summarise,
Excess demand at the existing ⇒ Competition among the buyers ⇒ Rise in the price level ⇒ New equilibrium ⇒ Rise in both quantity demanded as well as price.
Question 17.
What is revenue deficit ? [1]
Answer:
Revenue deficit refers to excess of rev-enue expenditure over revenue receipts during the given financial year.
Question 26.
An economy is in equilibrium. From the following data about an economy calculate investment expenditure:
(i) Income = 10000
(ii) Marginal propensity to consume = 0.9
(iii) Autonomous consumption = 100
Answer:
C = \(\overline{c}\) + by
= 100 + 0.9 × 10000 C
⇒ ₹ 9,100
Investment = Y – C
⇒ 10,000 – 9,100
⇒ ₹ 900
Question 27.
Assuming that increase in investment is ₹ 800 crore and marginal propensity to consume is 0. 8, explain the working of multiplier. [6]
Answer:
The working of multiplier can be explained as follows: We are given that the value of MPC = 0.8 and also that initial increase in investment is ₹ 800 crore. This implies that with every increase of ₹ 1 in the income, people consume 0.8 part of the increased income i.e, people consume ₹ 0.80 and save ₹ 0.20
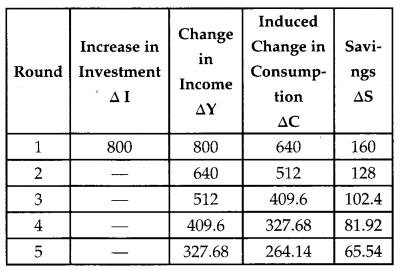
The table shows that initial increase in investment of ₹ 800 will lead to a change in income by ₹ 800 in the first round. As MPC is 0.8, so people will consume 0.8 of the increased income (i.e. ₹ 640), thereby saving ₹ 160. This will be termed as leakage (as it is not ploughed back into the economy).
In the next round, due to the increase in the consumption expenditure by ₹ 640, there will be an increase in income ₹ 640. The people will again spend the increased income i.e. ₹ 512 and save the rest part of the income ₹ 128.
In the third round, similarly the increased consumption expenditure of ₹ 512 will cause a change in the income by ₹ 512. They will spend a part of this income on consumption i.e., ₹ 409.6 and will save the rest of the increased income ₹ 102.4.
This process will continue and the income will go on increasing as a result of increase in consumption. The total change (ΔY) = ₹ 4000 (approx) and the change in the investment (ΔI) will be 800.
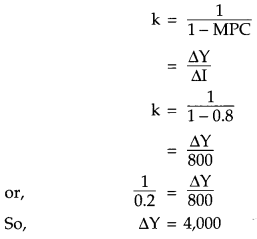
Thus, we can observe that an initial increase in the investment by ₹ 800 crore results in increase of income and output by ₹ 4000 crore.
Question 29.
Calculate (a) national income (b) net national disposable income: **
Answer:
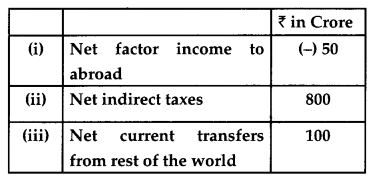
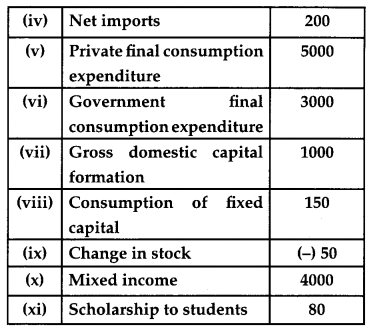
(a) National Income = (v) +(vi) + (vii) – (iv) – (viii) – (iii) – (i)
= 5000 + 3000 + 1000 – 200 – 150 – 800 – (- 50)
= 9000 – 200-950 + 50
= 9000 – 200 – 900
= 9000 – 1100
= ₹ 7900 Crores .
CBSE Previous Year Question Papers Class 12 Economics 2017 Delhi Set – III
Note : Except for the following questions, all the remaining questions have been asked in previous sets.
Section – A
Question 6.
Explain the problem of “how to produce’. [3]
Answer:
It is the problem relating to the choice of technique of production. Which technique should be used in production – whether labour , intensive or capital intensive ? Labour intensive technique uses more of labour as compared to capital while capital intensive tecnhique uses more of capital as compared to labour.
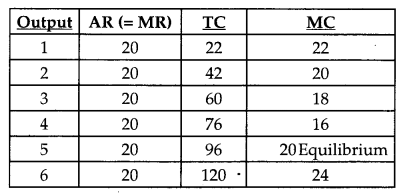
Question 15.
Using marginal cost and marginal revenue approach, find out the level of output at which producer will be in equilibrium. Give reasons for your answer.
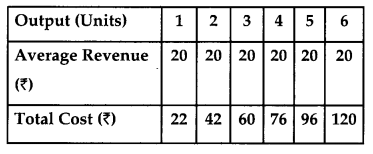
Answer:
Section – B
Question 26.
An economy is in equilibrium. From the following data, calculate autonomous consumption. [4]
(i) Income = 10000
(ii) Marginal propersnty to save = 0.2
(iii) Investment = 1500
Answer:
(a) Income = 10,000
(b) Marginal Propensity to save = 0.2
(c) Investment = 1500
Y = C + I
10,000 = C + 1500
C = 8500
MPC = 1 – MPS
= 1 – 0.2
= 0.80
C = \(\overline{\mathrm{c}}\) + by
8500 = \(\overline{\mathrm{c}}\) + 0.80 × 10,000
8500 = \(\overline{\mathrm{c}}\) + 8000
\(\overline{\mathrm{c}}\) = 8500 – 8000
= ₹ 500
Question 29.
Calculate (a) net national product at market price and (b) gross national disposable income : **