CBSE Previous Year Question Papers Class 12 Economics 2014 Outside Delhi
Time allowed : 3 hours
Maximum marks: 70
** Answer is not given due to change in the present syllabus
CBSE Previous Year Question Papers Class 12 Economics 2014 Outside Delhi Set – I
Section – A
Question 1.
The government has started promoting foreign capital. What is its economic value in the context of Production Possibilities Frontier ? [1]
Answer:
Promotion of foreign capital by the government will lead to an increment in resources as fresh investment into the country. It will increase the production in the country and will lead to a rightward shift in Production Possibility Frontier (PPF).
Question 2.
Define indifference curve. [1]
Answer:
A curve that shows different combinations of two commodities that yield the same level of satisfaction to a consumer is called an indifference curve.
Question 3.
Define marginal product. [1]
Answer:
Marginal product refers to the change in the total output brought by employing one additional unit of labour. Algebraically, marginal product = change in total product/change in
labour units MP = \(\frac{\Delta \mathrm{TP}}{\Delta \mathrm{L}}\)
Question 4.
What is market supply of a product? [1]
Answer:
The total quantity of a commodity supplied by all the producers at a given price during a given period of time is called the market supply of a product.
Question 5.
What is imperfect oligopoly? [1]
Answer:
When the firms produce different products in an oligopoly market, it is called imperfect oligopoly, e.g., automobile industry.
Question 6.
Why is Production Possibilities Curve concave? Explain. [3]
Answer:
The Production Possibility Curve is concave because marginal rate of transformation, which is the slope of the curve, increases continuously as each additional unit of one good is produced by reducing quantity of the other good. It means to produce more and more units of one good, more and more units of other good need to be sacrificed. MRT and opportunity cost increases because no resource is equally efficient in production of all goods. This can be explained with the help of the following diagram.
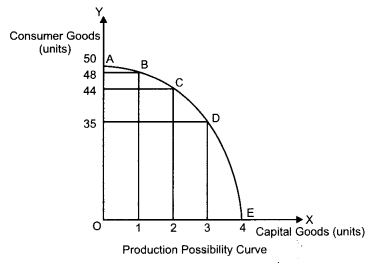
In the above figure, AE represents the PPC for capital goods and consumer goods. Suppose that the initial production point is B, where 1 unit of capital good and 48 units of consumer goods are produced. To produce one additional unit of capital good, 4 units of consumer good must be sacrificed (point C). Thus, at point C, the opportunity cost of one additional capital good is 4 units of consumer goods. Further moving to point D, to produce one more unit of capital good, 9 units of consumer goods must be sacrificed. That is, the opportunity cost rises to 9 units of consumer goods. Thus, as we move down the PPC from point C to point D, the opportunity cost and MRT increases. This confirms tire concave shape of the PPC.
Question 7.
When the price of a good falls from ₹ 10 to ₹8 per unit, its demand rises from 20 units to 24 units. What can you say about price elasticity of demand of the good through the ‘expenditure approach’ ?** [3]
Question 8.
Explain how technological progress is a determinant of supply of a good by a firm. [3]
OR
Explain how input prices are a determinant of supply of a good by a firm.
Answer:
The level of technology directly affects the supply of a good, i.e., while other things remain the same, there exists a positive relationship between the state of technology and the quantity produced. With the appreciation in the level of production techniques, per unit cost of production goes down. This encourages the producers to produce higher quantities of goods, thereby increasing the supply of the goods.
On the contrary, a depreciation in the production technology raises the per unit cost of production, thereby decreasing the supply of good.
OR
Input prices are related to the supply of a good. If the prices of inputs increases then the cost of production also increases, while other things remain the same. Due to the rise in the cost of production, it becomes relatively less profitable for a producer to produce the good. Consequently, lesser quantity is supplied at the given price. On the other hand, if the input prices falls, the cost of production also falls, thereby enabling the producer to supply more quantities of output at the given price. Thus, the change in the input prices positively affects the supply of a product.
Question 9.
Why is Average Revenue always equal to price? [3]
Answer:
Average Revenue (AR) is defined as the revenue earned per unit of output sold. AR is the same as the price (P) of the output (Q). Algebraically, it can be expressed as follows :
AR = TR/Q, where TR is total revenue,
TR = P × Q
∴ AR = ⇒ AR = P
Thus, AR is always equal to the price of the output.
Question 10.
Why is the number of firms small in an oligopoly? Explain. [3]
Answer:
Oligopoly refers to the form of market where very few big firms (giants) own major control over the whole market by producing significant portion of the market demand. The number of firms is small in oligopoly, because there exists a cut-throat competition among the firms which makes it very difficult for any new firm to enter the industry. Moreover, as the existing firms are the only giants in the market, new entry into the market is associated with high costs, which further narrows the scope for a new entrant.
Question 11.
A consumer consumes only two goods X and Y and is in equilibrium. Show that when the price of good X rises, the consumer buys less of good X. Use utility analysis. [4]
OR
Given the price of a good, how will a consumer decide as to how much quantity of that good to buy? Use utility analysis.
Answer:
In case of two commodities, the consumer’s equilibrium is attained at that point, where; the utility derived from each additional unit of the rupee spent on each of the goods is equal. That is, Marginal Utility of a Rupee spent on the good X (i.e., MUx/Py) is equal to the Marginal Utility of a Rupee spent on the good Y (i.e., MUy/Py), which in turn is equal to the Marginal Utility of Money (MUy). That is,
MUx/Px = MUy/Py = MUM
However, when the price of commodity X rises, the ratio of marginal utility to price of X (MUx/ Px) becomes lower than that of Y, that is MUx/ Px< MUy/Py.
In such a case, the consumer rearranges his consumption combination such that the equality is again restored. He would decrease his consumption of commodity X. With the decrease in the consumption of commodity X, marginal utility of X rises. As a result, the ratio of marginal utility to price of X rises. The consumer would continue decreasing the consumption of commodity X till the equality between the ratio of marginal utility to price in case of X and Y is again reached.
OR
In order to decide, how much of a good to buy at a given price, a consumer compares Marginal Utility (MU) of the good with its price (P). The consumer will be at equilibrium, when the Marginal Utility of the good will be equal to the price of the good. i.e., MUx = Px. If MUx > Px that is, when price is lesser than the Marginal Utility, then the consumer will buy more of that good. On the other hand, if MUx < Px, that is when price is more than the Marginal Utility, then the consumer will buy less of good. This is reflected in the following diagram.
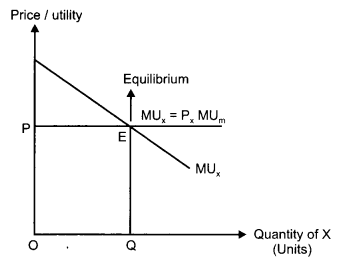
In the figure, the quantity of commodity x is represented on the x-axis, while, the price and the utility are represented on the y-axis. OP is the price of the commodity. MUX curve is downward sloping representing diminishing Marginal Utility of x. The consumer attains consumer’s equilibrium at point E, where, the Marginal Utility becomes equal to the price of the commodity.
Question 12.
Give the meaning of “inferior” good and explain the same with the help of an example. [4]
Answer:
Inferior goods refer to those goods that share an inverse relationship with the income of a consumer. As income increases the demand for inferior goods fall and vice-versa. This is because with an increase in the income, the consumer tends to shift demand to superior quality goods, thereby, reducing the demand for inferior goods.
For example, coarse cereals can be considered as inferior goods. A good can be normal or inferior depending on the level of consumer’s income. For instance, at a very low level of income, coarse cereals may be a normal good. However, for higher income level, ceteris paribus, coarse cereals will be an inferior good because with an increase in income, a consumer will reduce his/ her consumption of inferior cereals and it will be substituted by superior cereals.
Question 13.
Giving reasons, explain the ‘Law of Variable Proportions’. [4]
Answer:
The Law of Variable Proportions states that if more and more of variable factor (labour) is combined with the same quantity of fixed factor (capital), then initially the total product will increase but gradually after a point, the total product will become smaller and smaller. MP of variable factor may initially rise but eventually a situation will come when MP of variable factor starts declining. It may go to zero or even negative.
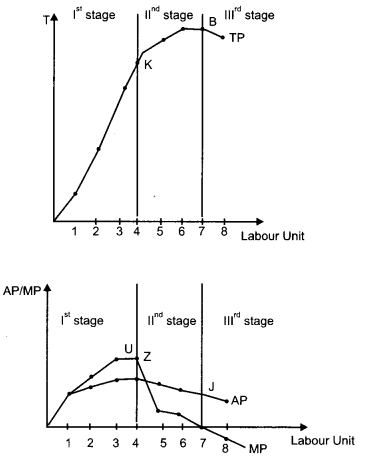
In the upper panel, TP is the Total Product curve. In the lower panel, AP represents the Average Product curve and MP represents the Marginal Product curve. According to the Law of Variable Proportions, the whole production phase can be distinguished into three different production stages.
Ist Stage: Increasing Returns to a Factor During this phase, TP curve increases at an increasing rate and is also accompanied by rising MP curve in the lower panel. TP continues to increase at an increasing rate till point K (inflexion point). Corresponding to the inflexion point, K, the MP curve attains its maximum point (U). Throughout this stage, the marginal product of labour is rising which implies that production (or total product) can be increased by employing more units of labour. The first stage of production is also known as non-economic zone as a rational producer will not operate profitably in this stage.
Reasons for Increasing Returns to a Factor
1. Underutilisation of the fixed factor: In the first stage of production, there are not enough labour units to fully utilize the fixed factor. Therefore, the firm can increase its output just by combining more and more of labour inputs with the fixed factor, thereby; the output of the additional unit of labour (i.e., MP) tends to rise.
2. Division of labour : The increase in the labour input enables the division of labour, which further increases the efficiency and productivity of the labour.
3. Specialisation of labour: Due to the division of labour, specialization of individual labour unit increases, which in turn raises the overall efficiency and productivity. Consequently, the MP curve rises and TP curve continues to rise.
IInd Stage: Diminishing Returns to a Factor In this stage, the TP curve increases but at a decreasing rate and attains its maximum at point B, where it remains constant. On the other hand, in the lower panel, the MP curve continues to fall and cuts AP from its maximum point Z, where MP equal AP. When TP attains its maximum point, corresponding to it, MP becomes zero. AP, in this stage initially rises, attains its maximum point at Z and thereafter, starts falling. This stage is known as the economic zone as any rational producer produces in this stage.
Reasons for Decreasing Returns to a Factor
1. Full utilization of fixed factor : In this stage, the fixed factor is utilized to its maximum level as more and more of labour inputs are employed.
2. Imperfect substitutability between labour and capital: The variable factors are imperfect substitute for the fixed factor. Therefore, the firm cannot substitute labour for capital and as a result diminishing returns takes place.
3. Optimum Proportion/Ideal Factor Ratio: The optimum proportion (or ideal factor ratio) is a fixed ratio in which the labour and capital inputs are employed. These factors will be the most efficient if they are employed as per the optimum proportion. If this proportion is disturbed (by combining more of labour inputs tp the fixed units of capital), then the efficiency of the factors will fall, thereby to the diminishing returns to the factor.
IIIrd Stage: Negative Returns to a Factor This stage begins from the point B on the TP curve. Throughout this stage, TP curve falls and MP curve becomes (crosses the x-axis) negative. Simultaneously, the AP curve continues to fall and approaches the x-axis (but does not touch it). This stage is also known as non-economic zone as any rational producer would not operate in this zone. The addition to the total output in this stage by the additional labour unit (i.e. marginal product) is negative. This implies that employing more labour would not contribute anything to the total product but will add to cost of the production in form of additional wage.
Question 14.
Explain why is an indifference curve (a) downward sloping and (b) convex. [6]
OR
Explain the concept of ‘Marginal Rate of Substitution’ with the help of a numerical example. Also explain its behaviour along an indifference curve.
Answer:
(a) Indifference curves are downward sloping from left to right. This reflects the fact that the consumer cannot simultaneously have more of both the goods. In other words, an increase in the quantity of one good is associated with the decrease in the quantity of the other good. This is in accordance with the assumption of monotonic preferences.
(b) Indifference curve is convex to the origin because as we move with the Indifference curve towards the right, the slope of IC(MRS) decreases. This is because as the consumer consumes more and more of one good, the marginal utility of the good falls. On the other hand, the marginal utility of the good sacrificed will rise. In other words, the”consumer is willing to sacrifice less and less for each additional unit of the other good consumed. Thus, as we move down the IC, MRS diminishes. This suggests the convex shape of indifference curve.
OR
Marginal rate of substitution refers to the rate at which a consumer is willing to substitute one good for each additional unit of other good. Algebraically, it is represented as follows :
MRS = Δx2/Δx1
This can be better understood with the help of the following numerical example.
| Bundles | Good X1 (Units) | Good X2 (Units) |
| A | 5 | 1 |
| B | 2 | 2 |
| C | 1 | 3 |
Now as we can see, a movement from Bundle A to Bundle B, in order to get one more units of Good X2, the consumer must sacrifice 3 units of Good X1. This implies that MRS = -3/1 = -3.
As we move down along the Indifference curve to the right, Marginal Rate of Substitution decreases. This is because as the consumer consumes more and more of one good, the marginal utility of that good falls. On the other hand, the marginal utility of the good sacrificed will rise. In other words, the consumer is willing to sacrifice less and less for each additional unit of the other good consumed. Thus, as we move down the IC, MRS diminishes. This suggests the convex shape of indifference curve. For instance, in the example given above, a further movement from bundle B to bundle C suggests that with one unit of increase in good 2, the consumer is willing to sacrifice good 1 falls to 1 unit. Thus, MRS falls.
Question 15.
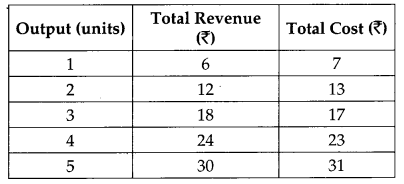
From the following information about a firm, find the firm’s equilibrium output in terms of marginal cost and marginal revenue. Give reasons. Also find profit at this output. [6]
Answer:
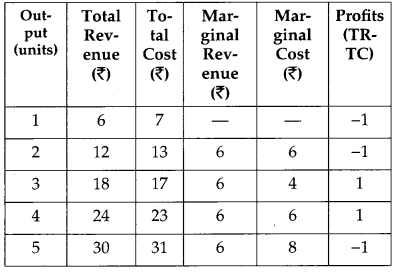
According to the MR-MC approach, the firm (or producer) will attain its equilibrium in two conditions.
1. MR = MC
2. MC must be rising after the equilibrium level of output.
Thus, by looking at the table, we can say that the firm is in equilibrium where output equal to 4 units. When output is 4 units, MR = MC (thus, the first condition is satisfied) and MC increases after the 4th unit of output (therefore, the second condition is satisfied).
When output is less than 4 units, if the firm produces slightly lesser level of output than 4 units, then the firm is facing price that exceeds the MC. This implies that higher profits can be achieved by increasing the level of output to 4 units. On the other hand, if the firm produces slightly higher level of output than 4 units, then the firm is facing price that falls short of the MC. This implies that higher profits can be achieved by reducing the output level to 4 units. Thus, only at 4 units of output, the producer will be in equilibrium and the profit maximizing output level, where Price (P) = MC and also MC curve is rising.
Question 16.
Market of a commodity is in equilibrium. Demand for the commodity ‘decreases’. Explain the chain of effects of this change till the market again reaches equilibrium. Use diagram. [6]
Answer:
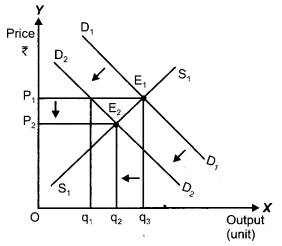
A decrease in the demand for the commodity leads to a fall in the equilibrium price and quantity. Let us understand how it happens : D1D1 and S1S1 represent the market demand and market supply respectively. The initial equilibrium occurs at E1, where the demand and the supply intersect each other. Due to the decrease in the demand for the commodity, the demand curve will shift leftward parallel from D1D1 to D2D2, while the supply curve will remain unchanged. Hence, there will be a situation of excess supply, equivalent to (q3 – q1). Consequently, the price will fall due to excess supply. The price will continue to fall until it reaches E2 (new equilibrium), where D2D2 intersects the supply curve S1S1. The equilibrium price falls from P1 to P2 and the equilibrium output falls from q3 to q2.
Section – B
Question 17.
What are the time deposits? [1]
Answer:
Time Deposits refer to those deposits that are held for a fixed (specific) period of time (called maturity period).
Question 18.
Define inflationary gap. [1]
Answer:
Due to the excess of aggregate demand, there exists a difference (or gap) between the actual level of aggregate demand and full employment level of demand. This difference is termed as inflationary gap.
Question 19.
What is full employment? [1]
Answer:
Full employment refers to the situation where the resources of a country i.e., labour are fully and efficiently employed. But, it is not a situation of zero unemployment. In other words, full employment can be said to take place when cyclical unemployment is zero while the structural and frictional unemployment are minimum.
Question 20.
Define fiscal deficit. [1]
Answer:
Fiscal deficit refer to the excess of total budget expenditure over the total revenue receipts excluding borrowings during a given fiscal year.
Fiscal Deficit = Total Budget Expenditure – Revenue Receipts + Capital Receipts excluding borrowings.
Question 21.
Define foreign exchange rate. [1]
Answer:
Foreign exchange rate refers to the rate at which price of one currency is measured in terms of other currency.
Question 22.
What are externalities? Give an example of a positive externality and its impact on welfare of the people. [3]
Answer:
An externality is said to occur when the action of one entity made an impact on other entity. These externalities can be positive as well as negative. A positive externality occurs when the action of one person positively affects the other. For instance, plantation by a person provides fresh air to others. Also, it contributes to the environment along with increasing the welfare of people. Thus, plantation by a person affects the life of the people living on the surrounding areas, it enhances the overall welfare of the society and creates positive externality.
Question 23.
Explain the significance of the ‘Unit of Account function of money.** [3]
OR
Explain the significance of the ‘Standard of Deferred Payment’ function of money.**
Question 24.
Is the following a revenue receipt or a capital receipt in the context of government budget and why? [3]
(i) Tax receipts
(ii) Disinvestment
Answer:
(i) Tax receipts are revenue receipts as these receipts neither creates any liability nor it creates any reduction in the assets of the government.
(ii) Disinvestment is treated as capital receipts because it results in the reduction of government assets.
Question 25.
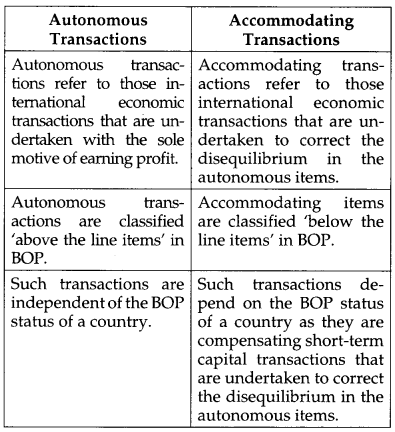
Distinguish between ‘autonomous’ and ‘accommodating’ Balance of Payments transactions. [3]
Answer:
Question 26.
Foreign exchange rate in India is on the rise recently. What impact is it likely to have on exports and how? [3]
Answer:
A rise in the exchange rate say from $1 = ₹ 40 to $1 = ₹ 50 implies that domestic country’s export to foreign countries have become cheaper because now foreigners can purchase ₹ 50 worth of goods for $1, as compared to the earlier situation where they could purchase only ₹ 40 worth of goods for $1. Thus, this raises the demand for exports.
Question 27.
Explain ‘Banker to the Government’ function of the central bank. [4]
OR
Explain ‘Bankers’ Bank’ function of the central bank.
Answer:
Central bank acts as a banker and financial advisor to the government. As a banker to the government, it performs the following functions.
- It manages the account of the government.
- It accepts receipts from the government and makes payment on behalf of it.
- It grants short-term loans and credit to the government. It performs the task of managing the public debt.
- The central bank advises the government on all the banking and financial matters. RBI gives loans to government when its expenditure exceeds its revenue. This is called deficit financing through funding from RBI.
OR
Central bank is the apex bank of all the commercial banks and financial institutions in the country. It holds the same relationship with the commercial banks as a commercial bank holds with its customer. The central bank accepts deposits from the commercial banks and holds it as reserves for them. The commercial banks are compulsorily required to hold a part of their deposits as reserve with the central bank in accordance with the cash reserve ratio (CRR). In addition to the CRR requirements, the commercial banks hold reserves with the central bank for clearing their settlements with other banks and to fulfill their requirements of interbank transfers.
Question 28.
Calculate Marginal Propensity to Consume from the following data about an economy which is in equilibrium: [4]
National income = 2000
Autonomous consumption expenditure = 200
Investment expenditure = 100
Answer:
Given,
National Income (Y) = 2000
Autonomous consumption expenditure = 200
Investment expenditure =100
As we know in equilibrium,
Y = C +1
Since, C = C + cY
We get Y = C + cY + I
2000 = 200 + c (2000) + 100
1700 = 2000c
⇒ c = 0.85
Therefore, marginal propensity to consume is 0.85.
Question 29.
Tax rates on higher income group have been increased. Which economic value does it reflect? Explain. [4]
Answer:
Increasing the tax rate on higher income groups leads to an increase in the tax revenue of the government without hurting the tax group. The government can, in turn, use the revenue thus, generated from this taxation to finance the welfare activities in the nation. Thus, by increasing the tax rate on the higher income groups, the government can bridge the gap between the rich and the poor, thereby moving the society towards being an egalitarian society. Moreover, the government can reallocate resources to maintain a balance between the social objectives of welfare maximization and economic objective of profit maximization.
Thus, we can say that by increasing the tax rate on higher income groups, the government satisfies the value of equality and welfare.
Question 30.
Calculate ‘Net National Product at Factor Cost’ and ‘Gross National Disposable Income**’ from the following: [6]
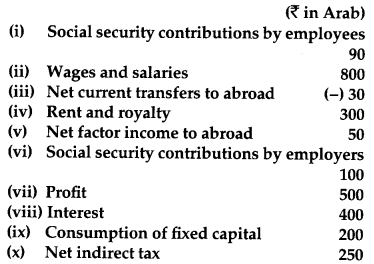
Answer:
NNPFC = Wages and Salaries + Social security contribution by employers + Rent and Royality + Profit + Interest – Net factor income to abroad
= 800 + 100 + 300 + 500 + 400 – 50
= ₹ 2050 Arab
Question 31.
How should the following be treated in estimating national income of a country? You must give reasons for your answer. [6]
(i) Taking care of aged parents
(ii) Payment of corporate tax
(iii) Expenditure on providing police services by the government
Answer:
(i) Taking care of aged parents: This will not be included in national income as it does not involve any production of goods and services. Moreover, these services that are meant for self-consumption and it is difficult to estimate the market value of such services.
(ii) Payment of corporate tax: Corporate tax is a part of corporate profit and therefore, it is included in national income of the country.
(iii) Expenditure on providing police services by the government: It is included in national income of a country as it forms a part of Government Final Consumption Expenditure.
Question 32.
When is an economy in equilibrium? Explain with the help of Saving and Investment functions. Also explain the changes that take place in an economy when the economy is not in equilibrium. Use diagram.
OR
Outline the steps required to be taken in deriving the Consumption Curve from the given Saving Curve. Use diagram.
Answer:
An economy is in equilibrium when either of the two conditions are satisfied.
1. Aggregate Demand = Aggregate Supply
2. Saving = Investment (Saving and Investment Approach)
According to this approach, the equilibrium is determined at that point, where the saving and investment are equal to each other. In other words, the equilibrium is established, where leakages are equal to the injections.
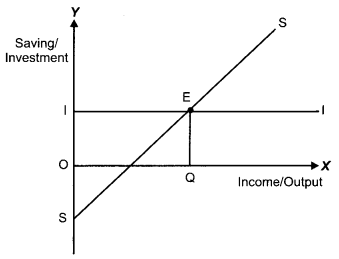
In the diagram, SS represents the saving curve and II represents the investment curve. The investment curve is a horizontal line as it represents the autonomous investment. At point E, Savings = Investment, thus point E represents the equilibrium point, where the saving curve SS and the investment curve II intersects. Accordingly, OQ is the equilibrium level of income (output).
To the left of point E, saving is less than investment. When I exceeds S i.e., when injections into the circular flow of income is greater than withdrawal from the income, implies that available supply of goods and services is less than what is required to meet the current demand for goods and services. In other words, we can understand this as low saving implies high consumption, which means that the output demand (due to high consumption) is greater than the planned output. Thus, there exists a portion of demand that remains unsatisfied, thereby, leading to an unplanned decline in the inventory. Thus to prevent inventories from falling, savings in the economy must be increase. This will happen till savings are again equal to investment and the equilibrium is restored.
To the right of point E, savings is greater than investment. When S exceeds I i.e., when withdrawal from the income is greater than injections into the circular flow of income, implies that total consumption expenditure is less than what is required to purchase the available supply of goods and services. In other words, we can understand this as high saving implies low consumption, which means that the output sold (due to low consumption) is less than the planned output. Thus, there exists a portion of produced output that remained unsold, thereby, leading to accumulation of unplanned inventory. Thus to prevent accumulation of inventories, savings in the economy will be reduced. This will happen till savings are again equal to investment and the equilibrium is restored.
OR
Derivation of Consumption Curve from Saving Curve
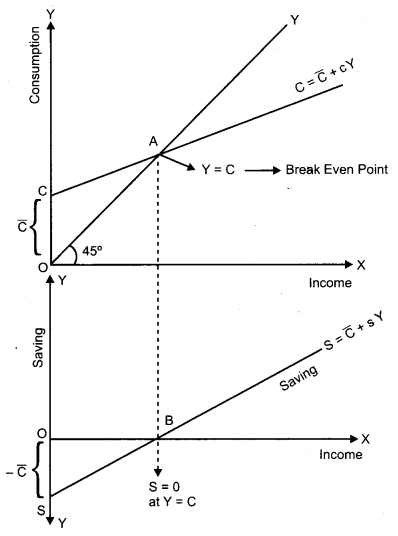
In the lower part of the diagram, \(-\overline{\mathrm{C}}\) + sY is the saving curve. OS equal to \(-\overline{\mathrm{C}}\) represents the saving at zero level of income.
Steps for the derivation of consumption curve from the saving curve are as follows :
(i) Corresponding to \(-\overline{\mathrm{C}}\) : in the saving function, we have \(\overline{\mathrm{C}}\) in the consumption function. That is, it represents the autonomous consumption or the consumption at zero level of income. The autonomous consumption is financed by drawing down savings.
(ii) At point B, saving equals zero. This suggests that whole of income is spent on consumption. That is, Y = C. This point is also known as the break-even point. This is shown by point A in the upper panel denoting Y = C.
(iii) By joining the points C and A we derive the straight upward sloping consumption curve.
(iv) CC is the required consumption curve.
CBSE Previous Year Question Papers Class 12 Economics 2014 Outside Delhi Set – II
Note: Except for the following questions, all the remaining questions have been asked in previous set.
Section – A
Question 3.
Give the meaning of ‘inelastic demand’. [1]
Answer:
When the percentage change in quantity demanded is less than the percentage change in prices; it is said to be inelastic demand.
Question 5.
Define marginal revenue. [1]
Answer:
Marginal revenue refers to an addition to the total revenue from producing one more unit of output.
Question 8.
When the price of a good rises from ₹ 10 to ₹ 12 per unit, its demand falls from 25 units to 20 units. What can you say about price elasticity of demand of the good through the ‘expenditure approach’?** [3]
Question 13.
How does change in price of a substitute good affect the demand of the given good? Explain with the help of an example. [4]
Answer:
Substitute goods refer to those goods that can be consumed in place of each other. In other words, they can be substituted with each other. For example, tea and coffee, Colgate and pepsodent, cello pens and reynolds pen, etc. In case of substitute goods, if the price of one good increases, the consumer shifts his demand to the other (substitute) good i.e., rise in the price of one good results in a rise in the demand of the other good and vice-versa.
For example, if price of tea increases, then the demand for tea will decrease. As a result, consumers will shift their consumption towards coffee and the demand for coffee will increase. (Price of tea ↑⇒ Demand for coffee ↑ ). It should be noted that the demand for a good moves in the same direction as that of the price of its substitute.
Question 18.
What is floating exchange rate ? [1]
Answer:
When the market forces of demand and supply determine the conversion rate of currencies, it is called floating exchange rate.
Section – B
Question 20.
Define deflationary gap. [1]
Answer:
Due to the deficiency in the aggregate demand, there exists a difference ( or gap) between the actual level of aggregate demand and full employment level of demand. This difference is termed as deflationary gap.
Question 24.
When foreign exchange rate in a country is on the rise, what impact is it likely to have on imports and how? [3]
Answer:
When foreign exchange rate in a country is on the rise then the demand for foreign currencies will be low. A rise in the exchange rate i.e., $1 = ₹ 40 to $1 = ₹ 50 implies that the goods of abroad become more expensive i.e,. it now cost ₹ 50 to purchase a commodity worth $1 instead of ₹ 40 earlier. This would result in a reduction in the demand for the foreign commodifies. Thus, there will be fall in imports.
Question 29.
Calculate investment expenditure from the following date about an economy which is in equilibrium. [4]
National Income = 1000
Marginal propensity to save = 0.20
Autonomous consumption expenditure = 100
Answer:
Given,
National Income (Y) = 1000
Marginal propensity to save (MPS) = 0.20
Autonomous consumption expenditure = 100
MPC (c) = 1 – MPS = 1 – 0.20 = 0.8
As we know in equilibrium,
Y = C + I
Since, C = C + cY
We Y = C + cY + I
1000 = 100 + 0.8 (1000) + I
1000 = 900 + 1
⇒ I = 100
Therefore, investment expenditure is ₹ 100.
Question 31.
Calculate ‘National Income’ and ‘Net National Disposable Income’** from the following: [6]
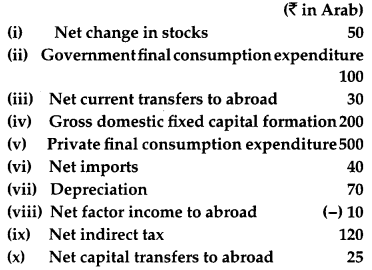
Answer:
NNPFC = Private final consumption expenditure + Government final consumption expenditure + Gross domestic fixed capital formation + Net change in stocks – Net imports – Depreciation – Net indirect tax – Net factor income to abroad
= 500 + 100 + 200 + 50 – 40 – 70 -120 – (-10)
= ₹ 630 Arab
CBSE Previous Year Question Papers Class 12 Economics 2014 Outside Delhi Set – III
Note : Except for the following questions, all the remaining questions have been asked in previous set.
Section – A
Question 1.
Define variable cost. [1]
Answer:
Variable cost always changes with the change in the level of output of a good.
Question 5.
What is meant by monotonic preferences? [1]
Answer:
Some goods offer high level of satisfaction to the consumer then he prefers more of that good. This is known as monotonic preferences.
Question 10.
A consumer buys 27 units of a good at a price of ₹10 per unit. When the price falls to ₹ 9 per unit, the demand rises to 30 units. What can you say about price elasticity of demand of the good through the ‘expenditure approach’** ? [3]
Question 11.
How does change in price of a complementary good affect the demand of the given good? Explain with the help of an example. [4]
Answer:
If we use a pair of goods together to satisfy a particular want or need then these goods are known as complementary goods. When one commodity’s price falls then the other good’s demand rises, e g., car and petrol.
Section – B
Question 17.
What is ‘excess demand’ in macroeconomics ? [1]
Answer:
At full employment level of output, the access of aggregate demand over aggregate supply is called excess demand in macroeconomics.
Question 19.
What is ‘managed floating exchange rate’ ? [1]
Answer:
It is a system in which the foreign exchange rate is determined by market forces. In this system the central bank stabilies the value of currency like appreciation or depreciation.
Question 23.
Explain the effect of appreciation of domestic currency on exports ? [3]
Answer:
When the price of domestic currency rises, it is called the appreciation of domestic currency. The benefit of appreciation of domestic currency is that we will require less currency to buy foreign currency. Because of this foreign buyer will have to pay high price for the domestic good. It will decrease in their demand,
i. e. reduces exports.
Question 27.
Calculate Autonomous Consumption Expenditure from the following data about an economy which is in equilibrium: [4]
National income = 500
Marginal Propensity to save = 0.30
Investment expenditure = 100
Answer:
Given:
National income, Y = 500 MPS = 0.30
Investment expenditure, I = 100
Marginal propensity to consume, MPC = 1 – MPS
= 1 – 0.30 = 0.70
We know that, Y = C +1….[AD = AS and AD = Cl]
⇒ Y = \(\overline{\mathrm{C}}\) + b(Y) + I …[QC = \(\overline{\mathrm{C}}\) + I]
⇒ 500 = \(\overline{\mathrm{C}}\) + 0.70 (500) + 100
\(\overline{\mathrm{C}}\) = 500 – 350 – 100
\(\overline{\mathrm{C}}\) = 50
Question 32.
Calculate the ‘Net National Product at Market Price’ and ‘Gross National Disposable Income**’ from the following: [4,2]
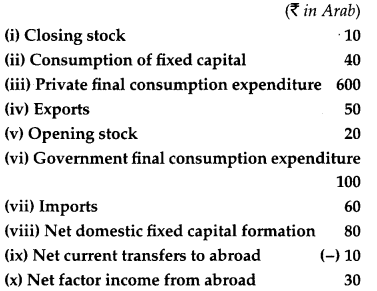
Answer:
NNPMP = Private final consumption expenditure + Government final consumption expenditure + Net domestic fixed capital formation + [Closing stock – Opening stock] + [Exports – Imports] – Net factor income from abroad
= (iii) + (vi) + (viii) + [(i) – (v)] + [(iv) – (vii)] – (x)
= 600 + 100 + 80 + [10 – 20] + [50 – 60] – 30
= 780 – 10 – 10 – 30 = ₹ 730 Arab