CBSE Previous Year Question Papers Class 12 Economics 2013 Outside Delhi
Time allowed : 3 hours
Maximum marks: 70
** Answer is not given due to change in the present syllabus
CBSE Previous Year Question Papers Class 12 Economics 2013 Outside Delhi Set – I
Section – A
Question 1.
Define marginal revenue. [1]
Answer:
Marginal Revenue (MR) is an addition to the Total Revenue (TR) from selling an additional unit of output.
Question 2.
What does a rightward shift of demand curve indicate? [1]
Answer:
The rightward shift of- demand curve indicates the increase in demand for a good due to change in the factors other than the price of the good. These factors can be increase in the income of a consumer, increase in the total number of consumers, increase in the price of substitute goods, etc.
Question 3.
Under which market form is a firm a price taker? [1]
Answer:
Under perfect competition, a firm is a price taker.
Question 4.
When is the demand for a good said to be perfectly inelastic? [1]
Answer:
When demand remains constant at all prices, the demand for a good is said to be perfectly inelastic, eg., Salt.
Question 5.
Give one reason for an “increase” in supply of a commodity. [1]
Answer:
‘A fall in the price of inputs’ can be one of the reasons for an increase in the supply of a commodity.
Question 6.
How is the demand for a good affected by a rise in the prices of other goods? Explain. [3]
Answer:
Price of other goods and demand for the given good : Any two goods are considered to be related to each other, when the demand for one good changes in response to the change in the price of the other good. The related goods can be classified into following two categories.
1. Substitute goods: Substitute goods refer to those goods that can be consumed in place of each other. In other words, they can be substituted for each other. For example, tea and coffee, Colgate and Pepsodent, Cello pens and Reynolds pen, etc.
For example, if price of tea increases, then the demand for tea will decrease. As a result, consumers will shift their consumption towards coffee and the demand for coffee will increase. (Price of Tea ↑ ⇒ Demand for Coffee ↑). It should be noted that the demand for a good moves in the same direction as that of the price of its substitute.
2. Complementary goods: Complementary goods refer to those goods that are consumed together. The joint consumption of these goods satisfies wants of the consumer. For example: tea and sugar, ink pen and ink, printer and paper, etc.
For example, sugar and tea are complementary goods. Since, sugar and tea are consumed together, so a rise in price of tea reduces the demand for sugar and vice-versa. It should be noted that demand for a good moves in the opposite direction of the price of its complementary goods. (Price of tea ↑ ⇒ demand for sugar ↑)
Question 7.
A firm supplies 10 units of a good at a price of ₹ 5 per unit. Price elasticity of supply is 1.25. What quantity will the firm supply at a price of ₹ 7 per unit? [3]
Answer:
As given in the question,
Qs = 10, P = 5 and Es = 1.25
At new price of ₹ 7 per unit
ΔP = 7 – 5 = 2
We know,
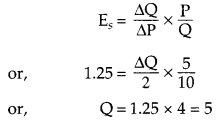
Thus, the new quantity that the firm would supply at a price of ₹ 7 per unit is 15 (5 + 10).
Question 8.
Explain the meaning of diminishing marginal rate of substitution with the help of a numerical example. [3]
Answer:
Marginal Rate of Substitution (MRS) refers to the rate at which a consumer is willing to substitute one good for each additional unit of other good. Algebraically,
MRS = \(\frac{\Delta Y}{\Delta X}\)
It shows how many units of good Y the consumer is willing to sacrifice to gain one additional unit of good X.
The following schedule explains the concept of MRS
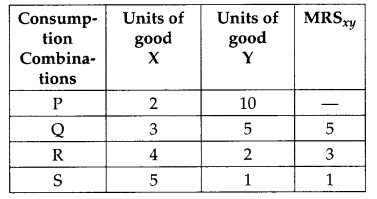
As the consumer moves from consumption combination P to consumption combination Q, consumption of good X increases from 2 units to 3 units while, the consumption of good Y falls from 10 units to 5 units. That is to gain one additional unit of good X, the consumer sacrifices 5 units of good Y. Thus, the MRS is 5.
Question 9.
From the following table, find out the level of output at which the producer will be in equilibrium. Give reasons for your answer. [3]
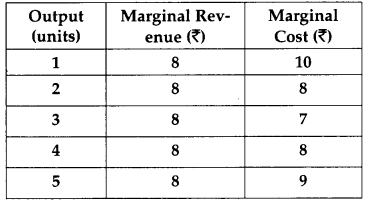
Answer:
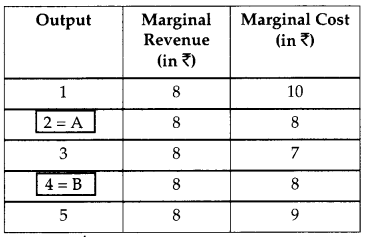
(i) MR = MC
(ii) MC is rising
As we can see in the given schedule, the first condition is being met in two cases.
That is at point A and B, MR = MC = 8. However, the second condition is being met only at point B. That is, in contrast to A where MC is falling from 8 to 7, the MC is rising from 8 to 9 point B. Thus, the producer equilibrium will be at point B or at 4 units output level.
Question 10.
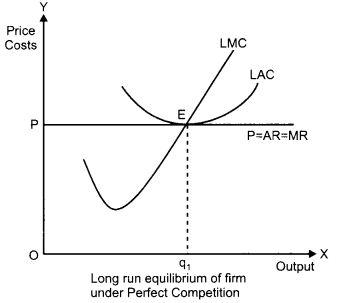
Why can a firm not earn abnormal profits under perfect competition in the long run? Explain. [3]
OR
Why is the demand curve of a firm under monopolistic competition more elastic than under monopoly? Explain
Answer:
Under perfect competition, no firm can earn abnormal profits in the long run. This is because if any firm in the long run earns abnormal profits (that is price > minimum of average cost curve), then new firms are attracted into the market. Due to the new entrants, the production of output increases, which then increases the supply of the output. This puts pressure on the price and price continues to fall, until it reaches the minimum of average cost curve. At the minimum of average cost curve, all the abnormal profits are wiped-out and no firm earns abnormal profit. Thus, in long run, under perfect competition, no firm can earn abnormal profits, rather earns only normal profit.
OR
The demand curve under monopolistic competition is more elastic than under monopoly. The reason behind this can be attributed to the fact that the nature of the goods available in both the markets is different. That is, under monopolistic market, there is a wide range of close substitutes available for the goods whereas, in monopoly market, the monopolist is the single seller and there are no close substitutes available for its product. Due to this, the demand curve under monopoly is less responsive to the changes in prices of the good. In contrast to this, in monopolistic market, due to the availability of a wide range of substitutes, there is a higher responsiveness of demand to the changes in prices. Hence, we can infer that the demand curve under monopolistic competition is more elastic than under monopoly.
Question 11.
Equilibrium price of an essential medicine is too high. Explain what possible steps can be taken to bring down the equilibrium price but only through the market forces. Also explain the series of changes that will occur in the market. [4]
Answer:
If the equilibrium price of an essential medicine is too high then the price can be reduced by increasing the supply of the commodity. This can be explained with the help of the following diagram.
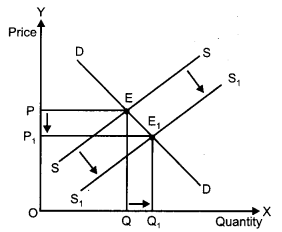
In the given diagram, we can see that the demand and supply forces intersect each other at point E. This is the initial market equilibrium with equilibrium price at P and equilibrium quantity at Q.
Now let us suppose that there is an increase in the supply of the commodity. This increase will shift the supply curve towards right from SS to S1S1. Holding the demand constant, at the initial price OP1 we can observe that there will be an excess supply. This excess supply will increase competition among the producers and consequently they would be willing to sell their output at a lower price. The price now, will continue to fall until it reaches OP1, where the new supply curve intersects the initial demand curve. This new equilibrium will be established at E1 with the new equilibrium price at OP1. Thus, we can observe that the equilibrium price has fallen from OP to OP1.
Question 12.
Explain the meaning of opportunity cost with the help of production possibility schedule. [4]
OR
With the help of suitable example explain the problem of Tor whom to produce’. [4]
Answer:
The cost of enjoying more of one good in terms of sacrificing the benefit of another good is called opportunity cost of the additional unit of the good.
Let us consider the example of the economy producing two goods – consumer goods and capital goods assuming the level of resources and technology remain same. The following schedule depicts the different possible combinations of the consumer goods and the capital goods that the economy can produce with its resource endowment and the available technology. This schedule is called production possibility schedule. Production Possibility schedule refers to the table showing different production possibilities of two goods with the given resources & technology.
| Production Possibilities | Consumer Goods (units) | Capital Goods (units) |
| A | 50 | 0 |
| B | 48 | 1 |
| C | 44 | 2 |
| D | 35 | 3 |
| E | 0 | 4 |
From the schedule, we can see that point A shows, if all the resources are utilized in the production of the consumer goods, then 50 units of consumer goods can be produced with zero units of capital goods. On the other hand, point E shows that if all the resources are utilized in the production of the capital goods, then 4 units of capital goods can be produced with zero units of consumer goods. Also, consider the movement from point B to point C. It implies that the economy is diverting resources from the production of consumer goods to the production of capital goods. In order to produce one additional unit of capital goods, the economy needs to sacrifice four units of consumer goods. Thus, the opportunity cost of producing one additional unit of capital goods is four units of consumer goods.
OR
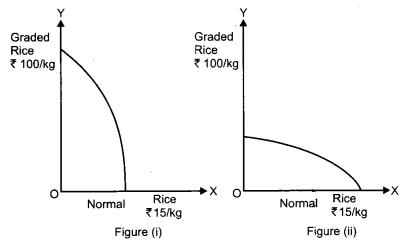
This economic problem basically focuses on the distribution of final goods and services produced. The distribution of the final goods and services is equivalent to the distribution of National Income (or National Product) among the factors of production such as land, labour, capital and entrepreneur.
For instance, imagine an economy producing two goods – normal rice (priced at ₹ 15/kg) and graded rice (priced at ₹ 100/kg). If the economy decides to cater the needs of the lower section of the society, then it would produce more of normal rice and less of the graded rice. In such a case, the PPC curve will be as depicted in figure (ii). On the other hand, if the economy decided to cater the needs of the higher section of the society, then it would produce more of the graded rice and less of the normal rice. In such a case, the PPC curve will be as depicted in figure (i).
Question 13.
A 5 percent fall in the price of a good raises its demand from 300 units to 318 units. Calculate its price elasticity of demand. [4]
Answer:
Given, the initial quantity Q1 = 300
New quantity Q2 = 318
So, DQ = 318 – 300 = 18
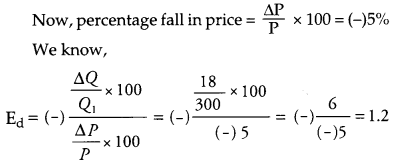
Thus, price elasticity of demand is 1.2
Question 14.
Explain three properties of indifference curves. [6]
OR
Explain the conditions of consumer’s equilibrium under indifference curve approach. [6]
Answer:
There are three properties of Indifference Curve.
1. Indifference curves are downward sloping to the right: Downward slope of the indifference curve to the right implies that a consumer cannot simultaneously have more of both the goods. An increase in the quantity of one good is associated with the decrease in the quantity of the other good. This is the accordance with the assumption of monotonic preferences.
2. Higher IC represents higher utility: Higher IC represents more goods means more utility because of the assumption of monotonic prefrence.
3. Shape of Indifference Curve: As we move down along the Indifference curve to the right, the slope of IC (MRS) decreases. This is because as the consumer consumes more and more of one good, the marginal utility of the good falls. On the other hand, the marginal utility of the good which is sacrificed rises. In other words, the consumer is willing to sacrifice less and less for each additional unit of the other good consumed. Thus, as we move down the IC, MRS diminishes. This suggests the convex shape of indifference curve.
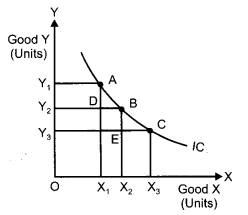
In the above figure, IC is the Indifference Curve.
At point A, MRSxy = AD / DB
At point B, MRSxy = BE / EC
BE / EC < AD / DB
MRS at B < MRS at A, so MRS has fallen.
OR
There are two conditions for consumer equilibrium under indifferences curves approach are :
(i) MRS = Ratio of Prices
(ii) MRS Continuously Falls.
Explanation:
(i) Let the two goods X and Y. The first condition for consumer’s equilibrum is that S = Px/Py. Now supposes MRS is greater than Px/Py. It mean that the consumer is willing to pay more for X than the price prevailing in the market. He will start buying more of X. As a result MRS continues to fall. It becomes equal to the ratio of prices and the equilibrium is established.
(ii) Unless MRS continuously falls, the equilibrium cannot be established. All other points lying on the budget line (such as point B and point C) are inferior to \(\left(x_{1}^{*} x_{2}^{*}\right)\)as they lie on a lower IC (i.e., IC1). Thus, the consumer will rearrange his consumption and will attempt to reach the equilibrium point, where the marginal rate of substitution is equal to the price ratio.
Let’s suppose that instead of point E, the consumer is at point B. At this point, MRS is greater than the price ratio. [i.e., MRS > \(\frac{P_{1}}{P_{2}}\)]
In this case, the consumer would tend to move towards point E by giving-up some amount of good 2 in order to consume more units of good 1. The consumer will continue to give-up the consumption of good 2, until, he reaches the point E, where, MRS becomes equal to the price ratio.
On the other hand, for all other points such as point C, MRS is lesser than the price ratio. [i e MRS < \(\frac{P_{1}}{P_{2}}\)] In this case, the consumer would tend to move towards point E by giving up some amount of good 1 to consume more units of good 2.
Thus, we can conclude that if the consumer is consuming any bundle other than the optimum one, then he would rearrange his consumption bundle in such a manner that the equality between the MRS and the price ratio is established and he attains the state of equilibrium.
Question 15.
If equilibrium price of a good is greater than its market price, explain all the changes that will take place in the market. Use diagram. [6]
Answer:
When equilibrium price of a good is more than its market price, then there will be competition among the buyers. This is because when the equilibrium price of a good is above the market price then it implies that there is a situation of excess demand.
This is explained with the help of the following diagram:
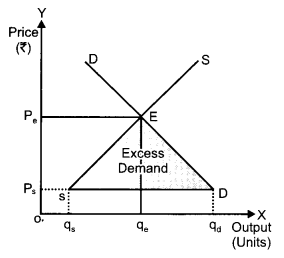
From the above figure, we can analyse that the market demand curve DD and the market supply curve SS intersects each other at the point which is known as equilibrium. The corresponding price and quantity are regarded as equilibrium price and equilibrium quantity, OPe and Oqe.
In other words, if the market price Ps is below the equilibrium price then at this price the market demand is more than the market supply. This implies a situation of excess demand. Thus, due to this the competition will exist among the buyers.
Question 16.
Giving reasons, state whether the following statements are true or false : [6]
(i) Average product will increase only when marginal product increases.
(ii) With increase in level of output, average fixed cost goes on falling till it reaches zero.
(iii) Under diminishing returns to a factor, total product continues to increase till marginal product reaches zero.
Answer:
(i) False, the average product does not only rise when the marginal product increases. But, there also exist a region where average product continues to rise corresponding to the falling marginal product. This can be explained with the help of the following diagram.
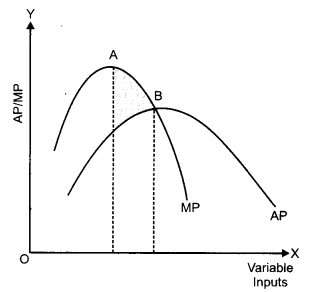
As we can see in the region AB, the average product continues to rise even when the marginal product is falling. The reason behind this can be attributed to the fact that the marginal component always change (rise/fall) at a faster rate in contrast to the average component.
(ii) False, with increase in the level of output, the average fixed cost continues to fall but it never reaches zero because average fixed cost is a rectangular hyperbola. That is, it can never be zero. This can be explained with the help of the following diagram.
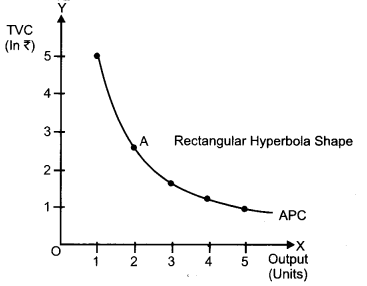
As we can see that the average fixed cost being a rectangular hyperbola tends to be zero, but however, it can never be zero.
(iii) True, under diminishing returns to a factor, total product continues to increase till marginal product reaches zero. This can be explained with the help of the following diagram.
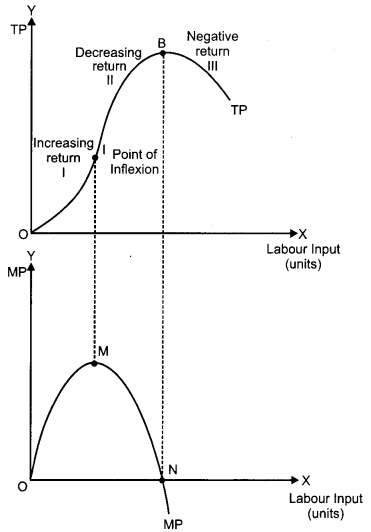
As we can see from the above figure, the total product continues to increase till the marginal product reaches zero. This is because from the point I till the point B as more and more labour inputs are combined with the constant level of fixed factor, it leads to the fuller utilization of the fixed factor. Consequently, the marginal product of the additional labour units falls, whereas, TP continues.to rise. The moment, where, the MP of the last labour unit becomes exactly equal to zero, then the TP reaches its maximum point.
Section – B
Question 17.
Give two examples of intermediate goods. [1]
Answer:
Fuel and steel or goods for resale.
Question 18.
State the components of supply of money. [1]
Answer:
The components of supply of money are the currency component and the deposit component.
Question 19.
What one step can be taken through market to reduce the consumption of a product harmful for health? [1]
Answer:
By imposing high tax on the product by the government, the consumption of a product, which is harmful for health will be reduced. Ex-wines, alcohol etc.
Question 20.
How can Reserve Bank of India help in bringing down the foreign exchange rate which is very high? [1]
Answer:
The Reserve Bank of India can devalue Indian rupee for bringing down the high rate of foreign exchange, RBI can sell foreign exchange from its reserves to bring down its value.
Question 21.
What is revenue deficit. [1]
Answer:
Excess of total revenue expenditure over the total receipts, of budget is called Revenue Deficit.
Question 22.
Explain the ‘medium of exchange’ function of money.** [3]
OR
Explain the Tender of last resort’ function of central bank.**
Question 23.
Distinguish between revenue receipts and capital receipts. Give an example of each. [3]
Answer:
| Basis of Difference | Capital Receipts |
Revenue Receipts |
| Definition | Capital receipts refer to those receipts of the government which causes a reduction in the government assets and also creates a liability for the government. | Revenue receipts refer to those receipts of the government which neither creates any liability nor creates any reduction in the assets of the government. |
| Impact | Reduce government assets and create liabilities for government. | No effect on government assets and liabilities. |
| Example | Recovery of loans. | Tax receipts. |
Question 24.
How can budgetary policy be used to reduce inequalities of income? [3]
Answer:
Budgetary policy can be used by government for reducing inequalities of income. To achieve its target, government should formulate suitably its fiscal policy. Through its fiscal policy government should put tax on rich people and spend that revenue for the benefit of poor people. Goverment should levy more direct taxes because these are paid by rich people. Schemes for providing health services and education to poor people should be encouraged.
Question 25.
Explain the effect of depreciation of domestic currency on exports. [3]
Answer:
With the depreciation of the domestic currency, the demand for the exports (by the native country) rises. This is because depreciation of domestic currency results in the fall in the price of the domestic currency in terms of foreign currency. This makes the exports cheaper and dearer and thereby their foreign demand increases.
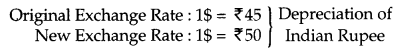
In the above case, Indian Rupee has depreciated in terms of US from ₹ 45 to ₹ 50. Consequent to this fall in the Indian Rupee, the demand for Indian exports will rise, as it is more cheaper for the Americans to buy the same goods at lower price of ₹ 50. Thus, as they can buy more goods using the same 1$ (as before), so this would raise the demand for Indian exports.
Question 26.
How is exchange rate determined in the foreign exchange market? Explain. [3]
Answer:
In the foreign exchange market, the equilibrium exchange rate is determined by the intersection of the demand curve for foreign currency and the supply curve of the foreign currency.
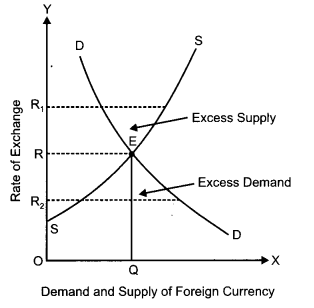
In the given diagram, DD is the demand curve for foreign currency and SS is the supply curve of foreign currency. The point E is the point of intersection, where the demand curve and the supply curve intersect. Thus, the point E represents the equilibrium exchange rate. OR is the equilibrium exchange rate and OQ is the quantity demanded and supplied of the foreign currencies.
If exchange rate rises to OR1, then the supply of foreign currency exceeds the demand for foreign. This will then force the exchange rate to fall back to OR due to the excess supply. On the contrary, if the exchange rate falls to OR2, then there exists excess demand. Consequently, the rate of exchange rises from OR2 to OR.
Thus, in the foreign exchange market, the exchange rate is determined by the intersection of the demand and supply of the foreign exchange. In case of any mismatches between the demand and the supply, then such mismatchs are corrected automatically by the invisible hands of the market i.e., demand and supply.
Question 27.
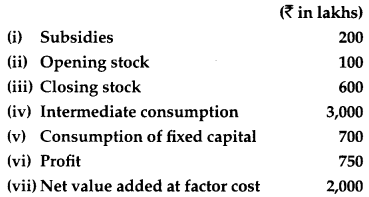
Calculate ‘Sales’ from the following data: [4]
Answer:
GDPMP = NDPFC – Subsidies + Depreciation
= 2000 – 200 + 700 = ₹ 2,500 lakhs
Now,
GDPMP = Sales+(ClosingStock-OpeningStock) – Intermediate Consumption
or, Sales
=GDPMP – (Closing Stock – Opening Stock) + Intermediate Consumption
= 2,500 – (600 – 100) + 3000
= ₹ 5,000 lakhs
Question 28.
Distinguish between “real” gross domestic product and “nominal” gross domestic product. Which of these is a better index of welfare of the people and why? [4]
OR
Distinguish between stocks and flows. Give two examples of each.
Answer:
The difference are as follows:
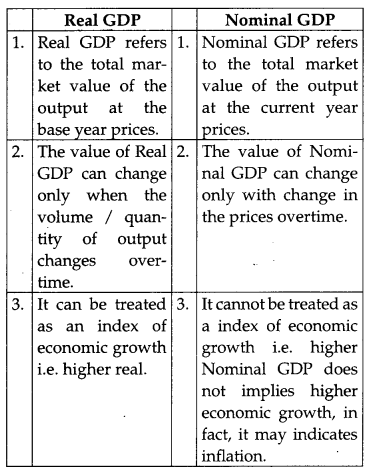
Real GDP is a better index of economic welfare. This is because a change in the Real GDP reflects a change in the quantity of goods and services produced. The change in the production of goods and services implies a change in the employment and income levels, thereby, indicating a change in the living standards of the people in an economy.
Or
| Stock | Flow |
| 1. Stocks are related to a point of time. | 1. Flows are related to a period of time. |
| 2. Stock is not time dimensional. | 2. Flow is time dimensional. |
| 3. These are affected by flows, such as more saving leads to more stock of capital. | 3. These are affected by stocks, such as, more stock of capital leads to more volume of output. |
| 4. Some flows are related to stock, i.e., money supply and change in money supply. | 4. Some stocks are related to flows, i.e., flow of water and quantity of water in a tank. |
| 5. Examples: Wealth, stock of capital, etc. | 5. Examples: Income, Savings, etc. |
Question 29.
Explain the credit creation role of commercial banks with the help of a numerical example. [4]
Answer:
The process of money creation by the commercial banks starts as soon as people deposit money in their respective bank accounts. After receiving the deposits, as per the central bank guidelines, the commercial banks maintain a portion of total deposits in form of cash reserves. The remaining portion left after maintaining cash reserves of the total deposits is then lend by the commercial bank to the general public in form of credit, loans and advances. Now assuming that all transactions in the economy are routed through the commercial banks, then the money borrowed by the borrowers again comes back to the banks in form of deposits. The commercial banks again keep a portion of the deposits as reserves and lend the rest. The deposit of money by the people in the banks and the subsequent lending of loans by the commercial banks is a recurring process. It is due to this continuous process that the commercial banks are able to create credit money a multiple times of the initial deposits.
The process of creation of money is explained with the help of the following numerical example.
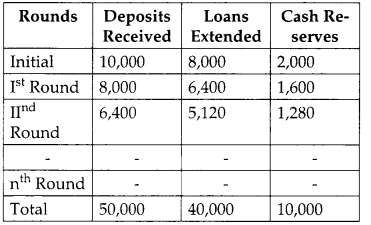
Suppose, initially the public deposited ₹ 10,000 with the banks. Assuming the Legal Reserve Ratio to be 20%, the banks keep ₹ 2,000 as minimum cash reserves and lend the balance amount of ₹ 8,000 (₹ 10,000 – ₹ 2,000) in form of loans and advances to the general public.
Now, if all the transactions taking place in the economy are routed only through banks then, the money borrowed by the borrowers is again routed back to the banks in form of deposits. Hence, in the second round there is an increment in the deposits with the banks by ₹ 8,000 and the total deposits with the banks now rises to ₹ 18,000 (that is, ₹ 10,000 + ₹ 8,000). Now, out of the new deposits of ₹ 8,000, the banks will keep 20% as reserves (that is, ₹ 1,600) and lend the remaining amount (that is ₹ 6,400). Again, this money will come back to the bank and in the third round, the total deposits rises to ₹ 24,400 (i.e., ₹ 18,000 ₹ 6,400).
The same process continues and with each round the total deposits with the banks increases. However; in every subsequent round the cash reserves diminishes. The process comes to an end when the total cash reserves (aggregate of cash reserves from the subsequent rounds) become equal to the initial deposits of ₹ 10,000 that were initially held by the banks. As per the above schedule, with the initial deposits of ₹ 10,000, the commercial banks have created money of ₹ 50,000.
Question 30.
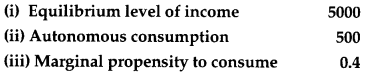
From the data given below about an economy. Calculate (a) investment expenditure and (b) consumption [6]
Answer:
Income Y = 5,000;
Autonomous Consumption, \(\overline{c}\) = 500;
MPC, \(\overline{c}\) = 0.4
Income = Y = ₹ 5000
MPC = c = 0.40
Now C = \(\overline{c}\) + cY
\(\overline{c}\) = 500 + 0.40 × 5000
\(\overline{c}\) = 500 + 2000
\(\overline{c}\) = 2500
Y = C + I
5000 = 2500 + 1
I = 2500
∴ (a) I = ₹ 2500
(b) c = ₹ 2500
Question 31.
Explain the meaning of under-employed equilibrium. Explain two measures by which full employment equilibrium can be reached. [6]
Answer:
A situation where the equilibrium level of income is established before the full employment level, is called under-employment equilibrium. At this level, aggregate demand is less than aggregate supply. So, for attaining the level of full employment, we have to increase the level of aggregate demand. There are two methods which can be used to increase the level of aggregate demand. These are as follows :
(i) Open market operations as an instrument to correct deficit demand: Open Market Operations refer to the buying and selling of securities either to the general public or to the commercial banks in an open market. To curtail deficit demand, the central bank purchases securities in the open market. With purchase of securities, the central bank pumps in additional money into the economy. With the additional money the level of Aggregate Demand in the economy increases. Thus, the deficit demand is corrected.
(ii) Bank rate as an instrument to correct deficit demand: Bank rate refers to the rate at which the central bank provides loans to the commercial banks. To curtail deficit demand, the central bank lowers the bank rate. This implies that cost of borrowing for the commercial banks from the central bank reduces. The commercial banks, in turn, reduce the lending rate (the rate at which they provide loans) for their customers. This reduction in the lending rate raises the borrowings capacity of the public, thereby, encourages the demand for loans and credit. Consequently, the level of Aggregate Demand in the economy increases and deficit demand is corrected.
Question 32.
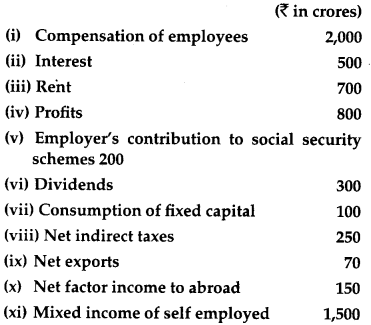
Calculate ‘Gross National Product at Market Price’ from the following data** : [6]
OR
Calculate “Gross National Disposable Income” from the following data** :
CBSE Previous Year Question Papers Class 12 Economics 2013 Outside Delhi Set – II
Note: Except for the following questions, all the remaining questions have been asked in previous sets.
Section – A
Question 5.
Give one reason for “decrease” in supply of a commodity. [1]
Answer:
Increase in the price of inputs.
Question 7.
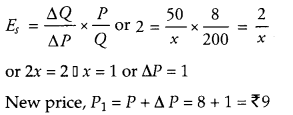
The price elasticity of supply of a commodity is 2.0. A firm supplies 200 units of it at a price of ₹ 8 per unit. At what price will it supply 250 units? [3]
Answer:
Given, Es = 2, P = ₹ 8, Q = 200 units, Q1 = 250 units
ΔQ = Q1 – Q = 250 – 200 = 50 units
Let the change in price, ΔP = x
We knot that,
Question 13.
When the price of a commodity falls by 20 percent, its demand rises from 400 units to 500 units. Calculate its price elasticity of demand. [4]
Answer:
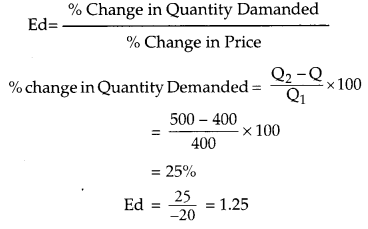
Section – B
Question 23.
Distinguish between revenue expenditure and capital expenditure in government Budget. Give an example of each. [3]
Answer:
Capital expenditure: An expenditure which results in the creation of assets or reduction in liabilities is treated as Capital expenditure, such as expenditure incurred on construction of buildings, roads, bridges, etc.
Revenue expenditure : An expenditure which does not result in creation of assets or reduction in liabilities, is called revenue expenditure such as payments of salaries, pensions, etc.
Question 29.
How does central bank control credit creation by commercial banks through open market operations? Explain. [4]
Answer:
Open market operations means the sale and purchase of all kinds of bills and securities by the “central bank in the open market.” In narrow terms, this method, signifies sale and purchase of government securities by central bank in the open market. In short, according to this method central bank controls the volume of credit by increasing or decreasing the quantity of money in the economy through sale and purchase of securities in the money market. The functioning of this method is like this : When central bank of the country wants to increase the volume of credit, it starts purchasing securities from the market. These securities are generally bought at a higher price than the market price. As such, banks start selling them, as a result of which their cash reserves increase, i.e., their liquid assets increase. As a result of this, banks now can create more credit.
On the contrary, when central bank wants to control the volume of credit, it starts selling securities in the market which are bought by the commercial banks. With the result, their cash reserves are reduced and this adversely affects their power of creating credit. In short, “for expanding the volume of credit central bank purchases securities and for reducing the volume of credit, it sells securities in the open market. In this way, according to this method, the volume of credit is controlled and regulated by controlling and regulating the cash reserves and credit creating power of commercial banks.
Question 31.
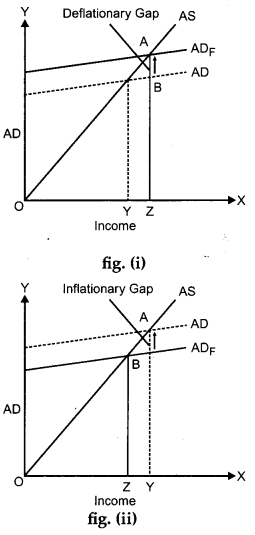
Distinguish between inflationary gap and deflationary gap. State two measures by which these can be corrected. [6]
Answer:
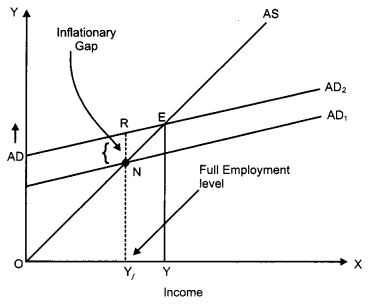
Deflationary gap: It prevails when aggregate demand is less than aggregate supply at the full employment level of output. In other words, deflationary gap represents the situation of unemployment attributable to the fact that at full employment level of output in the diagram RF is deflationary gap.
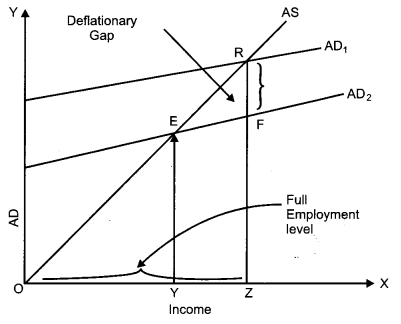
Inflationary gap – This is the situation where economy operates at a level which is greater than full employment. In other words, the gap between aggregate demand and aggregate supply is known as inflationary gap. In the diagram RN is inflationary gap. Volume of credit should be supervised and controlled for correcting the situation of deflationary and inflationary gap.
Two methods can be adopted for controlling these two gaps:
(i) Open market operations: If the central bank of the country will buy the securities from commercial banks, this will increase the capacity of credit paying of these banks. This way the deflationary situation can be corrected. If the central bank of the country sells the securities in the open market then the situation of inflationary gap will be controlled. Because of this the level of aggregate demand and their credit paying capacity will be reduced.
(ii) Bank Rate: Bank rate should be reduced. This will decline the rate of interest. This is for controlling the deflationary gap. In the case of inflationary gap bank should increase their rate, so that rate of interest will go up and the demand for credit will decline. This will affect aggregate demand.
Question 32.
In an economy C = 200 + 0.75V is the consumption function where C is consumption expenditure and Y is national income. Investment expenditure is 4,000. Calculate equilibrium level of income and consumption expenditure. [6]
Answer:
Consumption function, C = 200 + 0. 75Y,
Investment, I = 4,000
Now Y = C + IorY = 200 + 0.75Y + 4,000
Y – 0.75Y = 4,200 or 0.25Y = 4,200 ⇒ Y = 4,200 × \(\frac{100}{25}\)
Income, Y = 16,800
Consumption expenditure, C = 200 + 0.75Y
= 200 + 0.75 (16,800)
= 200 +12,600
= 12,800
CBSE Previous Year Question Papers Class 12 Economics 2013 Outside Delhi Set – III
Note: Except for the following questions, all the remaining questions have been asked in previous sets.
Section – A
Question 5.
Give the meaning of market supply. [1]
Answer:
It is the sum of the supply of a good by all its producers at a given price and for a given period of time.
Question 7.
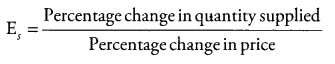
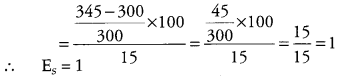
A 15 percent rise in the price of a commodity raises its supply from 300 units to 345 units. Calculate its price elasticity of supply. [3]
Answer:
Question 8.
Explain the conditions of consumer’s equilibrium under utility analysis. [3]
Answer:
Conditions for consumer’s equilibrium are:
(i) Budget line should be tangent to indifference curve, i.e.,
MRSxy = \(\frac{P_{x}}{P_{y}}\)
(Slope of IC) = Slope of Budget Line
(ii) Indifference curve should be convex to the point of origin, i.e., MRS is diminishing.
At equilibrium, marginal rate of substitution should be equal to the ratio of prices of the two goods:
MRSxy > Px/Py. It means that to obtain one extra unit of X the consumer is willing to sacrifice more than he has to sacrifice actually. In the process, the consumer gains. As he goes on obtaining more and more units of X, marginal utility of X goes on declining. Therefore, the consumer is willing to sacrifice less and less of Y each time he obtains one extra unit of X. As a result, MRSxy falls and ultimately becomes equal to Px/Py at some combination of X and Y. At this combination the consumer is in equilibrium.
MRSxy < Px/Py If the consumer attempts to obtain more units of X beyond the equilibrium level, MRSVV will become less than Px/Py and he will start losing. So he will not try to obtain more of X.
Question 13.
Price elasticity of demand of a good is -0.75. Calculate the percentage fall in its price that will result in 15 percent rise in its demand. [4]
Answer:
Elasticity of demand
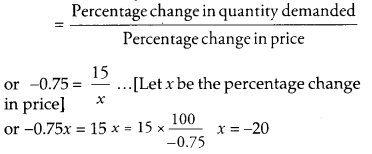
Price will fall by 20%
Section – B
Question 23.
State three sources each of revenue receipts and capital receipts in government budget. [3]
Answer:
Sources of revenue receipts :
- Direct tax
- Indirect tax and
- Dividend from public sector undertakings etc.
Sources of capital receipts :
- Recovery of loan,
- Sale of shares of public sector undertakings,
- Market borrowing etc.
Question 29.
Explain any two methods of credit control used by central bank. [4]
Answer:
Bank Rate: Bank rate is the rate which is fixed by the Central Bank. Credit is controlled by the central bank by making variations in the bank rate. This is the rate of interest which is charged from commercial bank for giving them loans. When the value of credit is to be increased, the bank rate reduces and vice-versa.
Open market operations : In the open market operations, some activities going on such as buying and selling the government securities in open market. When the central bank is purchasing securities from the market it means it wants to increase the volume of credit. Banks starts selling securities for increasing their cash reserves i.e., their liquid assets increase. On the other hand, when central bank starts selling securities in the market it means it wants to control the volume credit, which are bought by the commercial banks. In the result their cash reserves are reduced and this effects their power of creating credit.
Question 30.
From the following data about an economy, calculate (a) equilibrium level of national income and (b) total consumption expenditure at equilibrium level of national income.
(i) C = 200 + 0.5Y is the consumption function where C is consumption expenditure and Y is national income.
(ii) Investment expenditure is 1,500. [6]
Answer:
Given, consumption function, C = 200 + 0.5Y, Investment, I = 1,500
We know that, Y = C + I
Y = 200 + 0.5Y + 1,500 or Y = 1,700 + 0.5Y
or 0.5Y = 1,700 or Y = 1,700 × \(\frac{10}{5}\) = 3,400
(a) Equilibrium level of National Income,
Y = 3,400
(b) Total Consumption Expenditure,
C = 200 + 0.5Y = 200 + 0.5 (3,400)
= 200 + 1,700 = 1,900
Question 32.
Explain all the changes that will take place in an economy when aggregate demand is not equal to aggregate supply. [6]
Answer:
The equilibrium level may take place before the stage of full employment and also it may take place after the stage of full employment.
In deficient demand, the equilibrium level takes place before the full employment level. This is the case of involuntary unemployment. This signifies that deficiency of aggregate demand does not lead to the full use of given resources at the full employment level. Therefore, for reaching the stage of full employment where all the given resources are fully utilized, AD is required to be incorrected.
In the figure (i) OZ is the full employment level and OY is the actual output level, where AD equals to AS.
In the case of excess demand, the equilibrium takes place after the stage of full employment. The level of equilibrium is higher and cannot be met by full use of resources and output does not increase, only price increases in this case.
The necessary methods should be used for reducing the level of aggregate demand, for achieving the level of full employment.
In figure (ii) OZ is the full employment level and OY is the actual level of employments at equilibrium, where AD is equal to AS.