CBSE Previous Year Question Papers Class 12 Economics 2012 Delhi
Time allowed : 3 hours
Maximum marks: 100
** Answer is not given due to change in the present syllabus
CBSE Previous Year Question Papers Class 12 Economics 2012 Delhi Set – I
Note: Except for the following questions, all the remaining questions have been asked in previous sets.
Section – A
Question 1.
Give meaning of an Economy. [1]
Answer:
It is a system in which goods and services are produced, sold and bought in a country or region through which people get their living.
Question 2.
What is market demand ? [1]
Answer:
Market demand for a good is the sum total of demands of all the consumers in a market at a particular price during a given period of time.
Question 3.
What is the behaviour of average fixed cost as output increases? [1]
Answer:
Average Fixed Cost refers to the fixed cost per unit of output produced. It is derived by dividing the Total Fixed Cost by quantity of output produced. That is,
AFC = \(\frac{T F C}{Q}\)
As output increases, the average fixed cost (AFC) falls.
Question 4.
What is the behaviour of average revenue in a market in which a firm can sell more only by lowering the price? [1]
Answer:
AR curve slopes downward in a market in which firm can sell more only by lowering price.
Question 5.
What is a price taker firm? [1]
Answer:
A price taker firm is the firm which does not have any control over the existing market price and cannot influence it. A firm in a perfectly competitive market is regarded as a price taker firm.
Question 7.
Given price of a goods, how does a consumer decide as to how much of the good to buy? [3]
Answer:
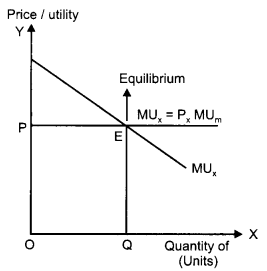
In order to decide, how much of a good to buy at a given price, a consumer compares Marginal Utility (MU) of the good with its price (P). The consumer will be at equilibrium, when the Marginal Utility of the good will be equal to the price of the good,
i.e., MUx = Px
If MUx > Px that is, when price is lesser than the Marginal Utility, then the consumer will buy more of that good.
On the other hand, if MUx < Px, that is, when price is more than the Marginal Utility, then the consumer will buy less of that good. This is reflected in the following diagram.
Question 8.
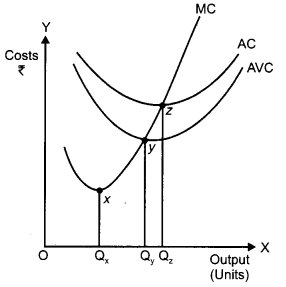
Draw Average Variable Cost, Average Total Cost and Marginal Cost curves in a single diagram. [3]
Answer:
Question 9.
An individual is both the owner and the manager of a shop taken on rent. Identify implicit cost and explicit cost from this information. Explain. [3]
Answer:
In this case the implicit cost consists of imputed value of the owner’s (manager’s) services and the explicit cost consists of the rent paid for the shop.
Implicit cost (Imputed cost) refers to cost of the factor that a producer neither hires nor purchases. Such costs are not actually paid by the producers yet are included in the cost of production. It is a difference between the economic profit and accounting profit. On the other hand, explicit costs are those costs that are borne directly by a firm and are paid to the factors of production. Another way of distinguishing the two is that while explicit costs are referred to as out-of¬pocket expenses, on the other hand, implicit costs do not result in any cash outlay from the business. Thus, in the case given, the rent for the shop is to be paid by the firm, so it is considered as explicit cost, while, the costs of owner’s service are considered as implicit costs, as no cash is expended for hiring such services.
Question 10.
Explain the implication of large number of sellers in a perfectly competitive market. [3]
OR
Explain why firms are mutually interdependent in an oligopoly market.
Answer:
There exist a large number of buyers and sellers in a perfectly competitive market. The number of sellers is so large that no individual firm owns the control over the market price of a commodity. Due to the large number of sellers in the market, there exists a perfect and free competition. A firm acts as a price taker while the price is determined by the ‘invisible hands of market’, i.e., by ‘demand for’ and ‘supply of’ goods. Thus, we can conclude that under perfectly competitive market, an individual firm is a price taker and not a price maker.
OR
Oligopoly market structure consists of only a few firms. The firms under such a market structure experience a high degree of mutual interdependence. This is because the price and the output decisions of the firms are interdependent on each other. The price and output policy of a firm affects the policies and profit of another firm. This is because when one firm lowers (rises) its prices, the rival firms may or may not follow suit. This makes the demand curve under the oligopoly market structure indeterminate, thereby makes the firms mutually interdependent in an oligopoly market.
Question 11.
Define an indifference curve. Explain why an indifference curve is downward sloping from left to right. [4]
Answer:
Indifference curve is a curve that depicts various combinations of two goods that provides a consumer with the same level of satisfaction.
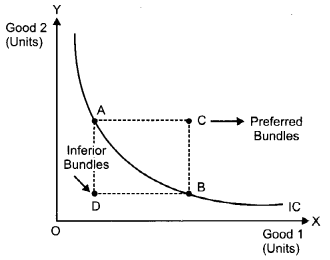
In the above figure, IC is the Indifference Curve. Each bundle on the IC shows those combinations of two goods that yield the consumer the same level of satisfaction.
An indifference curve is downward sloping from left to right. It implies that a consumer cannot simultaneously have more of both the goods. An increase in the quantity of one good is associated with the decrease in the quantity of the other good. This is in accordance with the assumption of monotonic preferences.
Question 12.
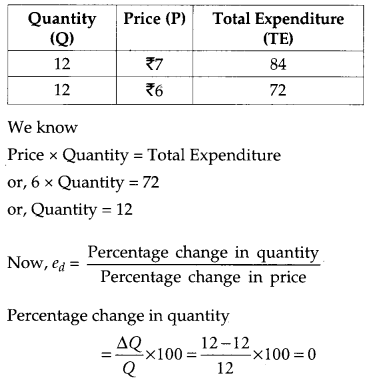
When price of good is ₹ 7 per unit a consumer buys 12 units. When price falls to ₹ 6 per unit he spends ₹ 72 on the good. Calculate price elasticity of demand by using the percentage method. Comment on the likely shape of demand curve based on this measure of elasticity. [4]
Answer:
Percentage change in price
= \(\frac{\Delta P}{P}\) × 100 = \(\frac{6-7}{7}\)× 100 = 14.28
Substituting the values in the formula of price elasticity of demand,
so, ed = \(\frac{0}{14.28}\) = 0
Thus, the demand is perfectly inelastic.
As the demand is perfectly inelastic, so the demand curve is a vertical straight line parallel to the price-axis.
Question 13.
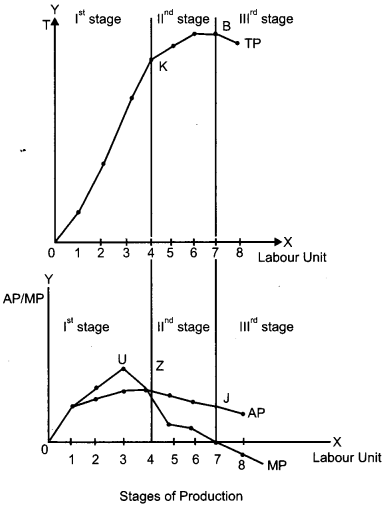
What does the Law of Variable Proportions show? State the behaviour of total product according to this law. [4]
OR
Explain how changes in prices of other products influence the supply of a given product.
Answer:
According to this law, if more and more units of variable factor (labour) are combined with the same quantity of fixed factor (capital) then, initially the total product will increase. However, after a certain point of time, total product will start declining.
Assumptions of Law of Variable Proportions
(i) Technology level remains constant
(ii) The units of variable factors are homogeneous
(iii) One of the inputs must be fixed
(vi) No change in the input prices – wages and interests.
Behaviour of TP
| Stages | Stage’s Name | TP | Range |
| I | Increasing Returns to a factor | TP increases at an increasing rate till K | From 0 to point K |
| II | Diminishing Returns to a factor | Increases at a decreasing rate and attains maximum | From K to point B |
| III | Negative Returns to a factor | TP starts to fall | From B onwards |
OR
The supply of a given good depends on the price of other goods. In other words, the supply of the good depends on the price of its substitute goods and on the price of its complementary goods. The supply of a given good shares positive (negative) relationship with the price of its substitute goods (complementary goods).
In case of substitute goods : If the price of the substitute goods falls, then the consumer will shift their preference towards that good. As a result, the demand of good reduces. Consequently, it is not profitable to supply this good, thereby the supply of good reduces. For example, tea and coffee are substitute goods. If the price of tea falls, then the supply of coffee will fall.
In case of complementary goods : If the price of the complementary goods falls, then the consumer will shift their preference towards the given good. This will lead to increase in the demand of the given good. As a result, it becomes profitable to supply more of the good. Thereby, the supply of the good increases. For example, petrol and car are complementary goods. If, the price of petrol falls, then the supply of cars will increase.
Question 14.
Explain how do the following influence demand for a good:
(i) Rise in income of the consumer.
(ii) Fall in prices of the related goods. [6]
Answer:
(i) Rise in the income of the consumer: In case of normal goods, a rise in the income of the consumer will increase the demand for. the good. This increases leads to the outward-parallel shift of the demand curve. However, in case of inferior goods, a rise in the income of the consumer will decrease the demand for the good. This decrease leads to the inward parallel shift of the demand curve.
(ii) Fall in prices of the related goods: Let us suppose that there are two goods X and Y that are perfect substitutes of each other. A fall in the price of say Good X will lead to fall in the demand for the Good Y and vice-versa. On the other hand, if X and Y are complementary goods, then a fall in the price of Good X will increase the demand for Good Y and vice-versa.
Question 15.
Explain the conditions of a producer’s equilibrium in terms of marginal cost and marginal revenue. Use diagram. [6]
Answer:
According to MR-MC approach, the producer attains equilibrium where the following two conditions are satisfied
(i) Necessary condition of First Order Condition (FOC)
(ii) Sufficient condition or Second Order Condition (SOC)
MC curve is rising and cuts MR curve from below:
That is, Slope of MC > 0
\(\frac{d(M C)}{d x}\) > 0
The conditions are explained below diagrammatically.
(i) Condition 1: MR = MC
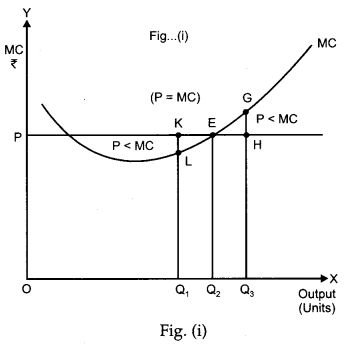
If price is greater than the MC the firm can increase profit by increasing the production. In figure (i) At output OQ1, price is KQ1 and the marginal cost is LQ1, such that KQ1 > LQ1. Therefore, OQ1 is not the profit maximizing output. This is due to the fact that the firm can increase its profit by increasing the production of output to OQ2.
On the other hand, if price is less than MC the firm can increase profit by lowering the production. At output OQ3, price is HQ3 and the marginal cost is GQ3, such that HQ3 < GQ3. Therefore, OQ3 is not the profit maximizing output. This is because the firm can increase its profit by reducing its output level to OQ2.
(ii) Condition 2: MC curve should be rising at the point of intersection with MR
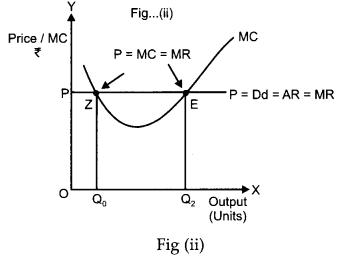
In the diagram, the MC curve cuts the price line (or MR) at two different points i.e., at ‘21 and ‘E’. The first order condition of profit maximization, i.e. Price (or MR = MC) is fulfilled at both these points.
At Point Z: MC is falling and is negatively sloped. Any slight increase in the output would imply that the price exceeds MC. This implies that the firm can increase profit by increasing the production.
At Point E: MR is equal to MC and also MC is rising. Any deviation from this point results in a lowering of profit for the firm.
Thus, both the first order condition (MR = MC) and the second order condition (MC curve should be rising at the point of intersection with MR) are satisfied at point E. Hence, point E is the equilibrium point.
Question 16.
Market for a good is in equilibrium. There is simultaneous “increase” both in demand and supply of the good. Explain its effect on market price. [6]
OR
Market for a good is in equilibrium. There is simultaneous “decrease” both in demand and supply of the good. Explain its effect on market price.
Answer:
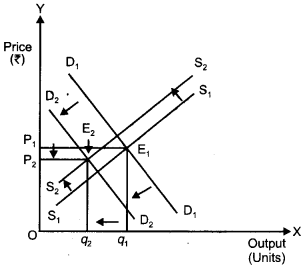
The simultaneous increase in demand and supply affects the equilibrium price and output depending on the magnitude of the change in demand and supply. The simultaneous increase in the demand and supply can be bifurcated into the following three conditions.
(i) When demand and Supply increase in the same proportion
According to the diagram, E1 is the initial equilibrium with equilibrium price P1 and equilibrium output q1.
Now let us suppose, the demand increases to D2D2 and the supply increases to S2S2 by the same proportion to that of demand. The new demand curve and the new supply curve intersect at point E2, which is the new equilibrium point. At the new equilibrium point, new equilibrium output is oq2, while the equilibrium price remains the same at oP1. Thus, an increase in the demand and the supply by same proportion leaves the equilibrium price unchanged.
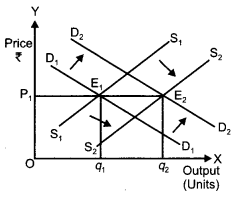
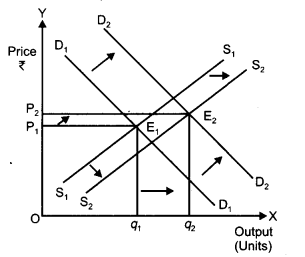
(ii) When Demand increases more than increase in Supply The initial demand curve and the initial supply curve intersect each other at point E1, with initial equilibrium price oP1 and initial equilibrium output oq1.
Now let us suppose that, demand increases and thereby demand curve shifts to D2D2. Simultaneously, the supply also rises and the supply curve shift to S2S2. However, the increase in the supply is less than the increase in the demand. The new supply curve and the new demand curve intersect each other at point E2, with higher equilibrium price oP2 and higher equilibrium output oq2. Thus, when the demand increases more than the increase in supply, the equilibrium price rises.
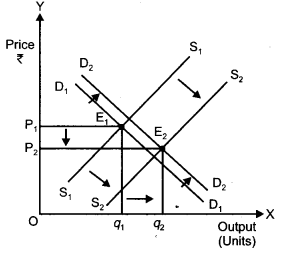
(iii) When Demand increases but lesser than the increase in Supply
Let the initial equilibrium be at point E1, with the equilibrium price oP1 and the equilibrium output oq1. Now, suppose that the demand increase to D2D2 and supply increases to S2S2. However, the increase in supply is more than that of the increase in demand. The new demand curve D2D2 and the new supply curve S2S2 intersect at point E2, with lower equilibrium price oP2. Thus, when the increase in demand is less than the increase in supply, the equilibrium price falls.
OR
The simultaneous decrease in demand and supply affects the equilibrium price and output depending on the magnitude of the change in demand and supply. The simultaneous decrease in the demand and supply can be bifurcated into the following three conditions.
(i) When Demand and Supply decreases in the same proportion
Let S1S1 and D1D1 be the initial supply curve and the initial demand curve respectively. The initial equilibrium is at point E1, with equilibrium price at oP1 and equilibrium output oq1.
Suppose that both demand and supply decrease by the same proportion. Consequently, the demand curve shifts to D2D2 and the supply curve shifts to S2S2. The new equilibrium is at point E2 with lower equilibrium output oq2 but the same equilibrium price oP2. Thus, When both demand and supply decrease in the same proportion, the equilibrium price remains the same, but the equilibrium quantity falls.
(ii) When Demand decreases more than the decrease in Supply
Let D1D1 and S1S1 be the initial demand curve and the initial supply curve, respectively. The initial equilibrium is at point E1 with equilibrium price P1 and equilibrium output q1.
Now let us suppose that, demand decrease to D2D2 and supply decreases by lesser proportion to S2S2. Consequently, the new equilibrium is established at point E2. At the new equilibrium, the equilibrium price falls to oP2 and equilibrium output falls to oq2. Thus, when decrease in demand is more than the decrease in supply, the equilibrium price falls accompanied by the fall in equilibrium output.
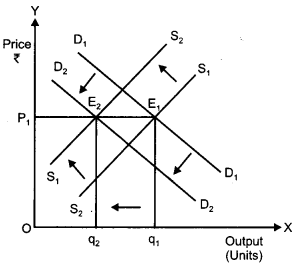
(iii) When decrease in demand is lesser than decrease in Supply.
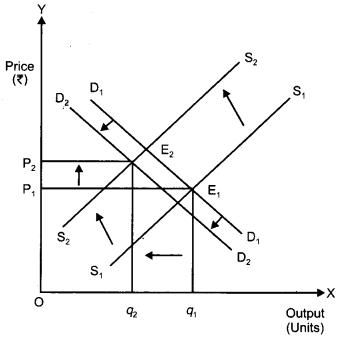
Let the initial equilibrium be at point E1, determined by the intersection of the initial demand curve D1D1 and the initial supply curve S1S1. The equilibrium price is oP1 and the equilibrium output is oq1.
Now suppose that, the demand decreases but lesser than the decrease in the supply. The demand curve shifts to D2D2 while the supply curve shifts to S2S2. The new equilibrium determined by the’ intersection of D2D2 and S2S2 is at point E2, where the equilibrium price increases to oP2 and the equilibrium quantity falls to oq2. Thus, when decrease in demand is lesser then the decrease in supply then the equilibrium price rises and equilibrium output falls to oq2.
Section – B
Question 17.
Define stock variable. [1]
Answer:
A variable whose value is measured at a point of time is called stock variable.
Question 18.
Define capital goods. [1]
Answer:
Capital goods are those goods which are used in producing other goods.
Question 19.
What are demand deposits? [1]
Answer:
Demand deposits are those deposits which can be withdrawn immediately by issuing cheques.
Question 20.
Define a Tax. [1]
Answer:
Taxes are the compulsory payments made by the households and the producing sectors to the government. Taxes as of two types namely, direct taxes (such as income tax) and indirect taxes (such as sales tax).
Question 21.
Give meaning of managed floating exchange rate. [1]
Answer:
A system where the government fix the exchange rate through central bank, it is called managed floating exchange rate.
Question 22.
Calculate Gross Value Added at Factor Cost: [3]
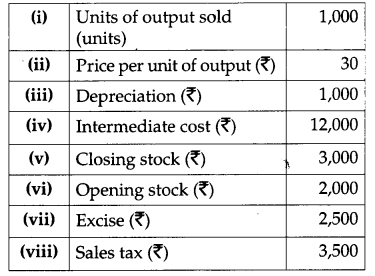
Answer:
Gross Value Added at Factor cost (GVApc) = Total Value of Sales + Change in Stock – Intermediate Consume
⇒ GVAFC (or GDPFC) = (1000 × 30) + (3000 – 2000) – 12000 – (3500 + 2500)
or, GVAFC = ₹ 13,000
Question 23.
Explain the significance of the ‘Store of Value’ function of money.** [3]
Question 24.
Outline the steps taken in deriving saving curve from the consumption curve. Use diagram. [3]
Answer:
In the diagram \(\overline{\mathrm{C}}\) + bY is the consumption curve. The 45° line is the aggregate supply curve.
At point E, consumption = income i.e. (Y = C)
\(\overline{\mathrm{C}}\) represents the autonomous consumption i.e., consumption at zero level of income. Steps for derivation of supply curve from consumption curve as follows:
(i) Corresponding to \(\overline{\mathrm{C}}\) in the consumption function we have \(\overline{\mathrm{C}}\) in the saving function. That is, there are negative savings equal to autonomous consumption at Y = 0. This is represented by S on the negative axis in the lower panel.
(ii) At point E (Y = \(\overline{\mathrm{C}}\)). This implies that all the income is spent on consumption expenditure. Thus, savings equal to zero. This is shown as S = 0 in lower panel. This point is also known as the Break-even point.
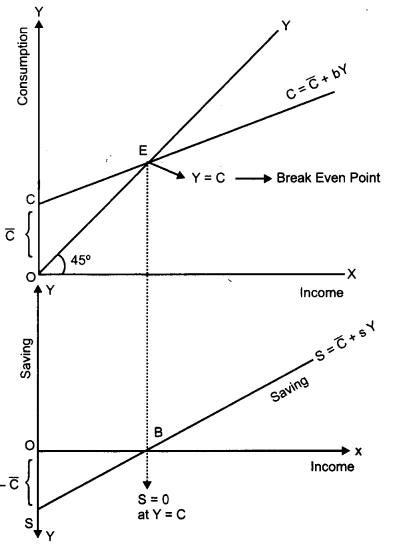
(iii) Beyond the break-even point, by connecting points S and Y we derive the straight upward sloping saving curve.-
(iv) SS is the required saving curve.
Question 25.
Find national income from the following: [3]
Autonomous consumption ₹ 100
Marginal propensity to consume 0.80
Investment ₹ 50
Answer:
C = ₹ 100
MPC (b) = 0.80
I = ₹ 50
At Equilibrium,
Y = C +1
or, Y = \(\overline{\mathrm{C}}\) + bY + I Y = \(\overline{\mathrm{C}}\) + bY + I
substituting the values, .
Y = 100 + 0.8Y + 50
or, 0.2 Y = 150
or, Y = ₹750
∴ National Income = ₹ 750
Question 26.
Distinguish between Revenue Expenditure and Capital Expenditure in a government budget. Give examples. [4]
OR
Explain the role of Government budget in allocation of resources.
Answer:
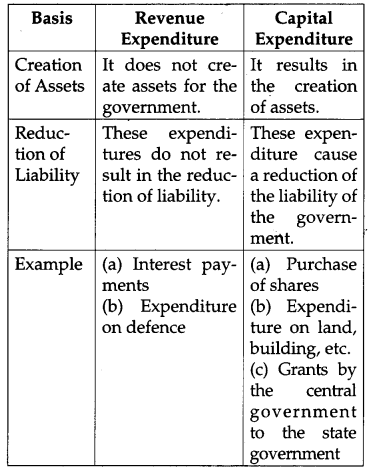
OR
In a mixed economy, private enterprises generally have a tendency to allocate resources to only those areas of production which are economically feasible and profitable. They are not guided by the service or welfare motive; in fact they are guided by the price signals. In such a situation, the government through its budgetary policy reallocates resources to maintain a balance between the social objectives of welfare maximization and the economic objective of profit maximization. For example, the government levies taxes on socially harmful goods such as tobacco and provides subsidies for the socially desirable goods such as good grains. Thus, the government through its policy allocates resources in such a manner as to maintain a balance between the profit motive and the social welfare.
Question 27.
Giving reason explain how should the following be treated in estimating national income: [6]
(i) Expenditure on fertilizers by a farmer.
(ii) Purchase of a tractor by a farmer.
Answer:
(i) Expenditure on fertilizers by a farmer should not be included in the estimation of National Income. This is because it is an intermediate consumption that a farmer purchases in order to enhance the crop productivity, so that he can sell more output.
(ii) Purchase of tractor by a farmer should be included in the estimation of National Income. This is because it is a part of Gross Domestic Capital Formation.
Question 28.
Explain the components of Legal Reverse Ratio. [6]
OR
Explain ‘bankers’ bank, function of Central bank.
Answer:
A certain minimum fraction of deposits which is legally compulsory for the commercial banks to keep in the form of liquid assets, is known as legal reserve ratio. There are two components of this ratio, those are as follows :
(i) Cash Reserve Ratio (CRR): It is a part of deposits which is kept with central bank as reserve in cash by the commercial banks.
(ii) Statutory Liquidity Ratio (SLR): It is a ratio of deposits which banks have to keep with themselves in the form gold or securities.
OR
Central bank is the apex bank of all the commercial banks and financial institutions in the country. It holds the same relationship with the commercial banks as commercial banks holds with its customer. The central bank accepts deposits from the commercial banks and holds it as reserves for them. The commercial banks are compulsorily required to hold a part of their deposits as reserves with the central bank in accordance with the cash reserve ratio (CRR). In addition to the CRR requirements, the commercial banks hold reserves with the central bank for clearing their settlements with other banks and fulfill their requirements to inter-bank transfers.
Question 29.
Explain ‘revenue deficit’ in a Government budget? What does it indicate? [6]
Answer:
Revenue deficit is equal to the excess of total revenue expenditure over the total revenue receipts. In short:
Revenue deficit = Total revenue expenditure – Total revenue receipts
Revenue deficit indicates the extra amount of current expenditure which cannot be met by revenue receipts. This shows the extent of borrowings which are required to meet this deficit. Revenue expenditure increases without a corresponding increase in the revenue receipts, revenue deficit increases and this calls for additional borrowing. This means liability of the government deficit increases and this calls for additional borrowing. This means liability of the government increases.
Question 30.
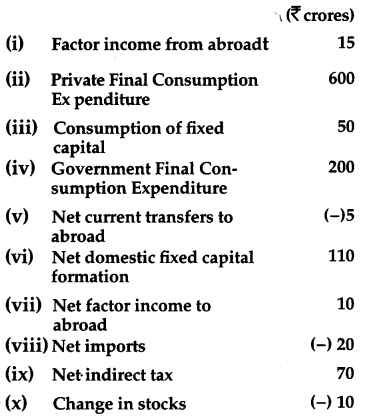
Find out (a) National income and (b) Net National Disposable Income** : [6]
Answer:
(a) National Income
= Private final consumption expenditure + Government consumption expenditure + [Net domestic fixed capital formation + Change in stock] – Net imports – Net indirect tax – Net factor income to abroad
= (ii) + (iv) + [(vi) + (x)] – (viii) – (ix) – (vii)
= 600 + 200 + [110 + (-10)] – (-20) – 70 – 10
= 600 + 200 + 100 + 20 – 70 – 10
= 920 – 80 = ₹ 840 crore
Question 31.
Explain the concept of ‘excess demand’ in macroeconomics. Also explain the role of open market operations in correcting it. [6]
OR
Explain the concept of ‘deficient demand’ in macroeconomics. Also explain the role of bank Rate in correction it.
Answer:
Concept of “Excess Demand”: When the equilibrium level of income is determined after the level of full employment, it is the situation of excess demand. At the level of full employment, aggregate demand is more than aggregate supply. It leads to the high prices and it creates inflationary gap or excess demand.
Role of Open Market Operations to Correct Excess Demand: Open Market Operations refer to the buying and selling of securities either to the public or to the commercial banks in an open market. To curtail excess demand the central bank sells securities in the open market. By selling the securities in the open market the central bank withdraws excess money from the economy. This result in a lower Aggregate Demand in the economy and excess demand is controlled.
OR
Concept of “Deficient Demand”: When the equilibrium level of income is determined before the level of full employment, it is the situation of deficient demand. In this situation aggregate demand is less than aggregate supply. It leads to the less production, rising unemployment level. All the resources will not be full employed at this level. This condition creates deflationary gap or deficient demand.
Role of Bank Rate to Correct Deficient Demand: Bank rate refers to the rate at which the central bank provides loans to the commercial banks. Thus to curtail deficit demand, the central bank lowers the bank rate. This implies that cost of borrowing for the commercial banks from the central bank reduces. The commercial banks in turn reduce the lending rate (the rate at which they provide loans) for their customers. This reduction in the lending rate raises the borrowing capacity of the public, thereby, encourages the demand for loans and credit. Consequently, the level of Aggregate Demand in the economy increases and deficit demand is corrected.
Question 32.
Explain the distinction between autonomous and accommodating transactions in balance of payments. Also explain the concept of balance of payments ‘deficit’ in this context. [6]
Answer:
| Autonomous Transactions | Accommodating Transactions |
| Autonomous transactions refer to those international economic transactions that are undertaken with the sole motive of earning profit. | Accompriodating transactions refer to those international economic transactions that are undertaken to correct the disequilibrium in the autonomous items. |
| Autonomous transactions are also called ‘above the line items’ in BOP. | Accommodating items are also called ‘below the line items’ in BOP |
| Such transactions are independent of the BOP status of a country. | Such transactions depend on the BOP status of a country as they are compensating short-term capital transactions that are undertaken to correct the disequilibrium in the autonomous items. |
When autonomous foreign exchange payments are more than autonomous foreign exchange receipts, this excess is called deficit in balance of payments.
CBSE Previous Year Question Papers Class 12 Economics 2012 Delhi Set – II
Note: Except for the following questions, all the remaining questions have been asked in previous sets.
Section – A
Question 6.
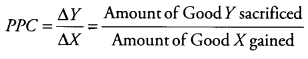
What is ‘Marginal Rate of Transformation’? Explain with the help of an example. [3]
Answer:
Marginal Rate of Transformation (MRT) refers to the amount of good Y that must be sacrificed in order to gain an additional unit of X, with full and efficient utilization of available resources. It is also known as marginal opportunity cost. MRT indicates the slope of PPC.
Production Possibility Curve
| Production Possibilities | Consumer Goods (units) | Capital Goods (units) |
| A | 50 | 0 |
| B | 48 | 1 |
| C | 44 | 2 |
| D | 35 | 3 |
| E | 0 | 4 |
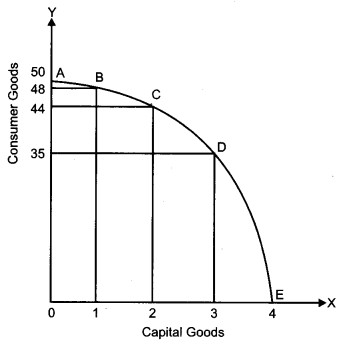
In the above figure, AE represents the PPC for good X and good Y. Suppose, the initial production point in B, where 1 unit of good X and 48 units of good Y are produced. To produce one additional unit of good X, 4 units of good Y must be sacrificed (point C). Thus, at point C, the MRT is 4 units of good Y.
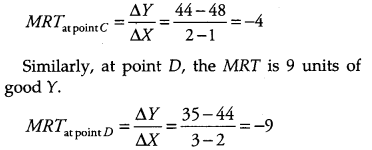
Thus, as we move down the PPC, MRT (or the opportunity cost) increases. This increasing MRT indicates the concave shape of PPC.
Question 9.
A producer borrows money and opens a shop. The shop premises is owned by him. Identify the implicit and explicit costs from this information. Explain. [4]
Answer:
In this case the implicit cost will consist of
(i) Imputed rent of the shop and
(ii) Imputed value of his own services
The explicit cost will consist of interest payment made on the borrowed money. Implicit cost (Imputed cost) refers to cost of the factor that a firm neither hires nor purchases. It is not actually paid by the producers but is included in the cost of production. It is estimated as the difference between the economic profit and accounting profit. On the other hand, explicit costs are those costs that are borne directly by the firm and paid to the factors of production.
Question 11.
Define Marginal Rate of Substitution. Explain why is an indifference curve convex? [4]
Answer:
The Marginal Rate of Substitution (MRS) is defined as the amount of good that a consumer is ready to forego or substitute for an additional unit of good 1. In other words, it represents the cost of good 1 that the consumer is ready to pay in terms of the other good. The MRS between two goods is given by the absolute value of the ratio of change in the consumption of good 2 to the change in the consumption of ‘ good 1. That is,
MRS1,2 = \(\left|\frac{\Delta x_{2}}{\Delta x_{1}}\right|\)
The IC is convex to the origin because of the diminishing MRS. As the consumer consumes more and more of one good, the marginal utility of the good falls. On the other hand, the marginal utility of the good which is sacrificed rises. In other words, the consumer is willing to sacrifice less and less for each additional unit of the other good consumed. Thus, as we move down the IC, MRS diminishes. This suggests the convex shape of indifference curve.
Question 12.
A consumer buys 10 units of a good at a price of ₹ 9 per unit. At price of ₹ 10 per unit he buys 9 units. What is price elasticity of demand. Use expenditure approach. Comment on the likely shape of demand curve on the basis of this measure of elasticity.** [6]
Section – B
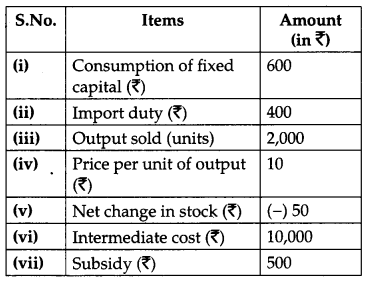
Question 22.
Calculate Net Value Added at Factor Cost: [3]
Answer:
NVAFC = Sales + Change in Stock – Intermediate Cost – Consumption of Fixed Capital – Net Indirect Taxes
Sales = Quantity × Price = 2,000 × 10 = ₹ 20,000
Net Indirect taxes = Taxes – subsidy
= Import duty – sub sidy
= ₹ 400 – 500 = (-100)
∴ NVAFC = 20,000 + (-50) – 10,000 – 600 (-100)
= 20,000 – 50 – 10,000 – 600 + 100
= ₹ 9,450 crore
Question 25.
Find ‘Investment’ from the following: [4]
| Items | Amount 0) |
| National Income | ₹ 500 |
| Autonomous Consumption | ₹ 100 |
| Marginal propensity to Consume | 0.75 |
Answer:
At equilibrium Y = C + I
or, Y = \(\overline{\mathrm{C}}\) + bY +1 where, b = MPC
500 = 100 + (0.75 × 500) + I
500 – 100 = 375 = I
∴ Investment = ₹ 25
Question 27.
Giving reason explain how should the following be treated in estimating national income :
(i) Payment of bonus by a firm
(ii) Payment of interest on a loan taken by an employee from the employer. [6]
Answer:
(i) Payment of bonus by a firm: Payment of bonus by a firm should be included in the national income because it is a part of the compensation of employees (while estimating National Income by Income Method).
(ii) Payment of interest on loan taken by employee from the employer: Payment of interest on loan taken by employee from the employer should be included in the national income because it is a part of operating surplus (while estimating National ’Income by Income Method).
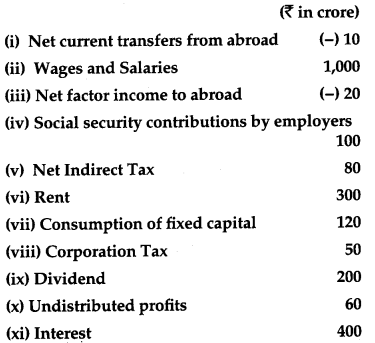
Question 30.
Find out (a) Net National Product at Market Price and (b) Gross National Disposable Income . [6]
Answer:
(a) Net National Product at Market Price = Wages and salaries + social security contributions by employers + Rent + Interest + Corporation tax + Dividend + Undistributed profits + Net indirect tax – Net factor income to abroad
= (ii) + (iv) + (vi) + (xi) + (viii) + (ix) + (x) + (v) – (iii)
= 1,000 + 100 + 300 + 400 + 50 + 200 + 60 + 80 – (-20)
= ₹ 2,210 crore
CBSE Previous Year Question Papers Class 12 Economics 2012 Delhi Set – III
Note : Except for the following questions, all the remaining questions have been asked in previous sets.
Section – A
Question 6.
State reasons why does an economic problem arise? [3]
Answer:
The following are the main causes due to which every economy faces economic problem.
(i) Unlimited human wants: Human wants never-ends and they keep on arising. The unlimited human wants require unlimited resources to get fulfilled. But no matter how well an economy is endowed with resources, it will fall short to fulfill every wants.
(ii) Limited availability of resources: Every economy has unlimited wants but its endowment of resources remains scarce to fulfill these unlimited wants.
(iii) Alternative uses: The scarce available resources have alternative uses. This implies resources can be allocated to the production of different goods and services. The allocation of resources to one use involves a cost in terms of sacrifice of the other possible uses. Therefore, every economy has to decide the allocation of its resources in the best possible manner by analyzing the opportunity cost.
Question 9.
A producer invests his own savings in starting a business and employs a manager to look after it. Identify implicit and explicit costs from his information. Explain. [4]
Answer:
In this implicit cost consists of imputed value of the interest on the saving and the explicit cost consists of the salary paid to the manager.
Implicit cost (Imputed cost) refers to cost of the factor that a producer neither hires nor purchases. Such costs are not actually paid by the producers yet are included in the cost of production. It is a difference between the economic profit and accounting profit. On the other hand, explicit costs are those costs that are borne directly by a firm and are paid to the factors of production. Another way of distinguishing the two is that while explicit costs are referred to as out-of pocket expenses, on the other hand, implicit costs do not result in any cash outlay from the business. Thus, in the case given, the salary is to be paid to the manager, so it is considered as explicit cost, while, the costs of investing (interest) producer’s saving is considered as implicit costs, as no cash is expended for borrowings these funds (savings).
Question 11.
Define an indifference map. Explain why an indifference curve to the right shows higher utility level. [4]
Answer:
Indifference map is a family or collection of indifference curves that depicts the , different levels of satisfaction and preferences of a consumer. Each indifference curve in an indifference map depicts a particular level of satisfaction.
Higher IC denotes higher level of satisfaction and lower IC denotes lower level of satisfaction.
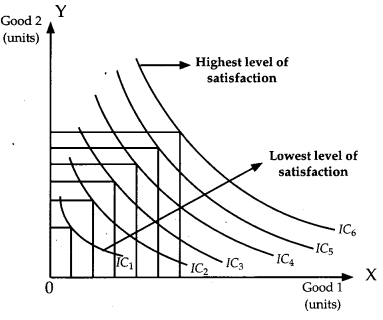
The above figure depicts an Indifference Map comprising of six indifference curves (from IC1 to IC6). As the consumer moves farther away from IC1 to higher indifference curves the level of satisfaction derived by the consumer increases. IC6 depicts the highest level of satisfaction. On the other hand, IC1 depicts the lowest level of satisfaction.
An indifference curve is downward sloping from left to right. It implies that a consumer cannot simultaneously have more of both the goods. An increase in the quantity of one good is associated with the decrease in the quantity of the other good. This is in accordance with the assumption of monotonic preferences & their is an inverse relation between good 1 & 2.
Question 12.
A consumer buys 20 units of a good at a price of ₹ 5 per unit. He incurs an expenditure of ₹ 20 when he buys 24 units. Calculate price elasticity of demand using the percentage method. Comment upon the likely shape of demand curve based on this information. [6]
Answer:
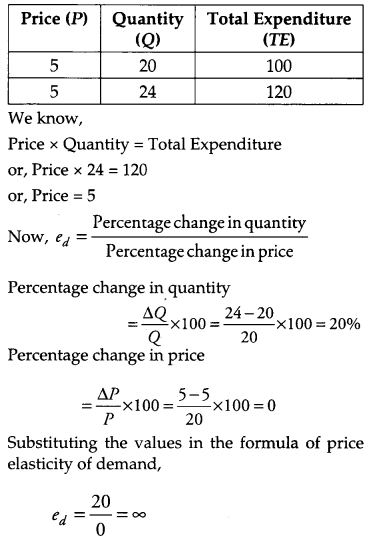
Thus, the demand is perfectly elastic.
As the demand is perfectly elastic, so the demand curve is a horizontal straight line parallel to the quantity-axis.
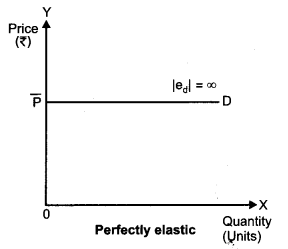
Hence, the likely shape of demand curve is Parallel to the X-axis, i.e., perfectly elastic.
Section – B
Question 22.
Find Net Value Added at Market Price [3]
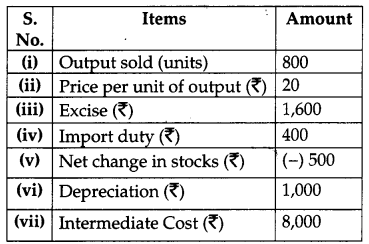
Answer:
Given:
Net Value Added at Market Prices (NDPMP) = Total Value of Sales + Change in Stock – Intermediate Consumption – Depreciation
NDPMP = (800 × 20) + (-500) – 8000 – 1000
or, NDPMP = ₹ 6,500
Question 25.
Find consumption expenditure from the following : [4]
| Items | Amount |
| Autonomous consumption | ₹ 100 |
| Marginal propensity to consume | 0.70 |
| National. Income | ₹ 1,000 |
Answer:
Given:
C = ₹ 100
MPC (b) = 0.70
Y = ₹ 1,000
To Calculate : Consumption Expenditure
Consumption Expenditure (C) = \(\overline{C}\) + bY = 100 + 0.70 × 1,000 = ₹ 800
Question 27.
Comparing reason explain how should the following be treated in estimating National Income:
(i) Interest paid by banks on deposits by individuals.
(ii) National debt interest. [6]
Answer:
(i) Interest is a factor payment by a producer, so, interest paid by banks on deposits by individuals is included in the estimation of National Income.
(ii) National debt interest is a transfer payment and this loan is taken for consumption purposes. So, it is not included in the estimation of National Income.
Question 30.
Find out (a) Gross National Product at Market Price and (b) Net Current Transfers from abroad: [6]
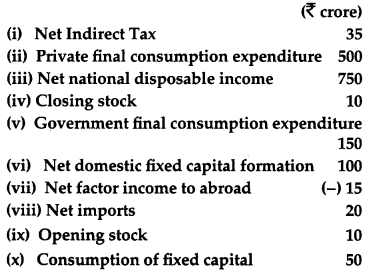
Answer:
(a) GNPMP
= Private final consumption expenditure + Government final consumption expenditure + (net domestic capital formation + Closing stock – Opening stock + Consumption of fixed capital – Net imports – Net factor income to abroad
= (ii) + (v) + [(vi) + (iv) – (ix) + (x)] – (viii) – (vii)
= 500 + 150 + (100 + 10 – 10 + 50) – 20 – (-15)
= 650 + 150 – 20 + 15
= 815 – 20 = ₹ 795 crore
(b) Net Current Transfer from abroad
= Net national disposable income – (GNPMP – Consumption of fixed capital)
= 750 – 795 + 50
= 800 – 795 = ₹ 5 crore